Chapter 29: Production Operations and Automation

From Deployment to Professional Operations at Scale

1. Introduction

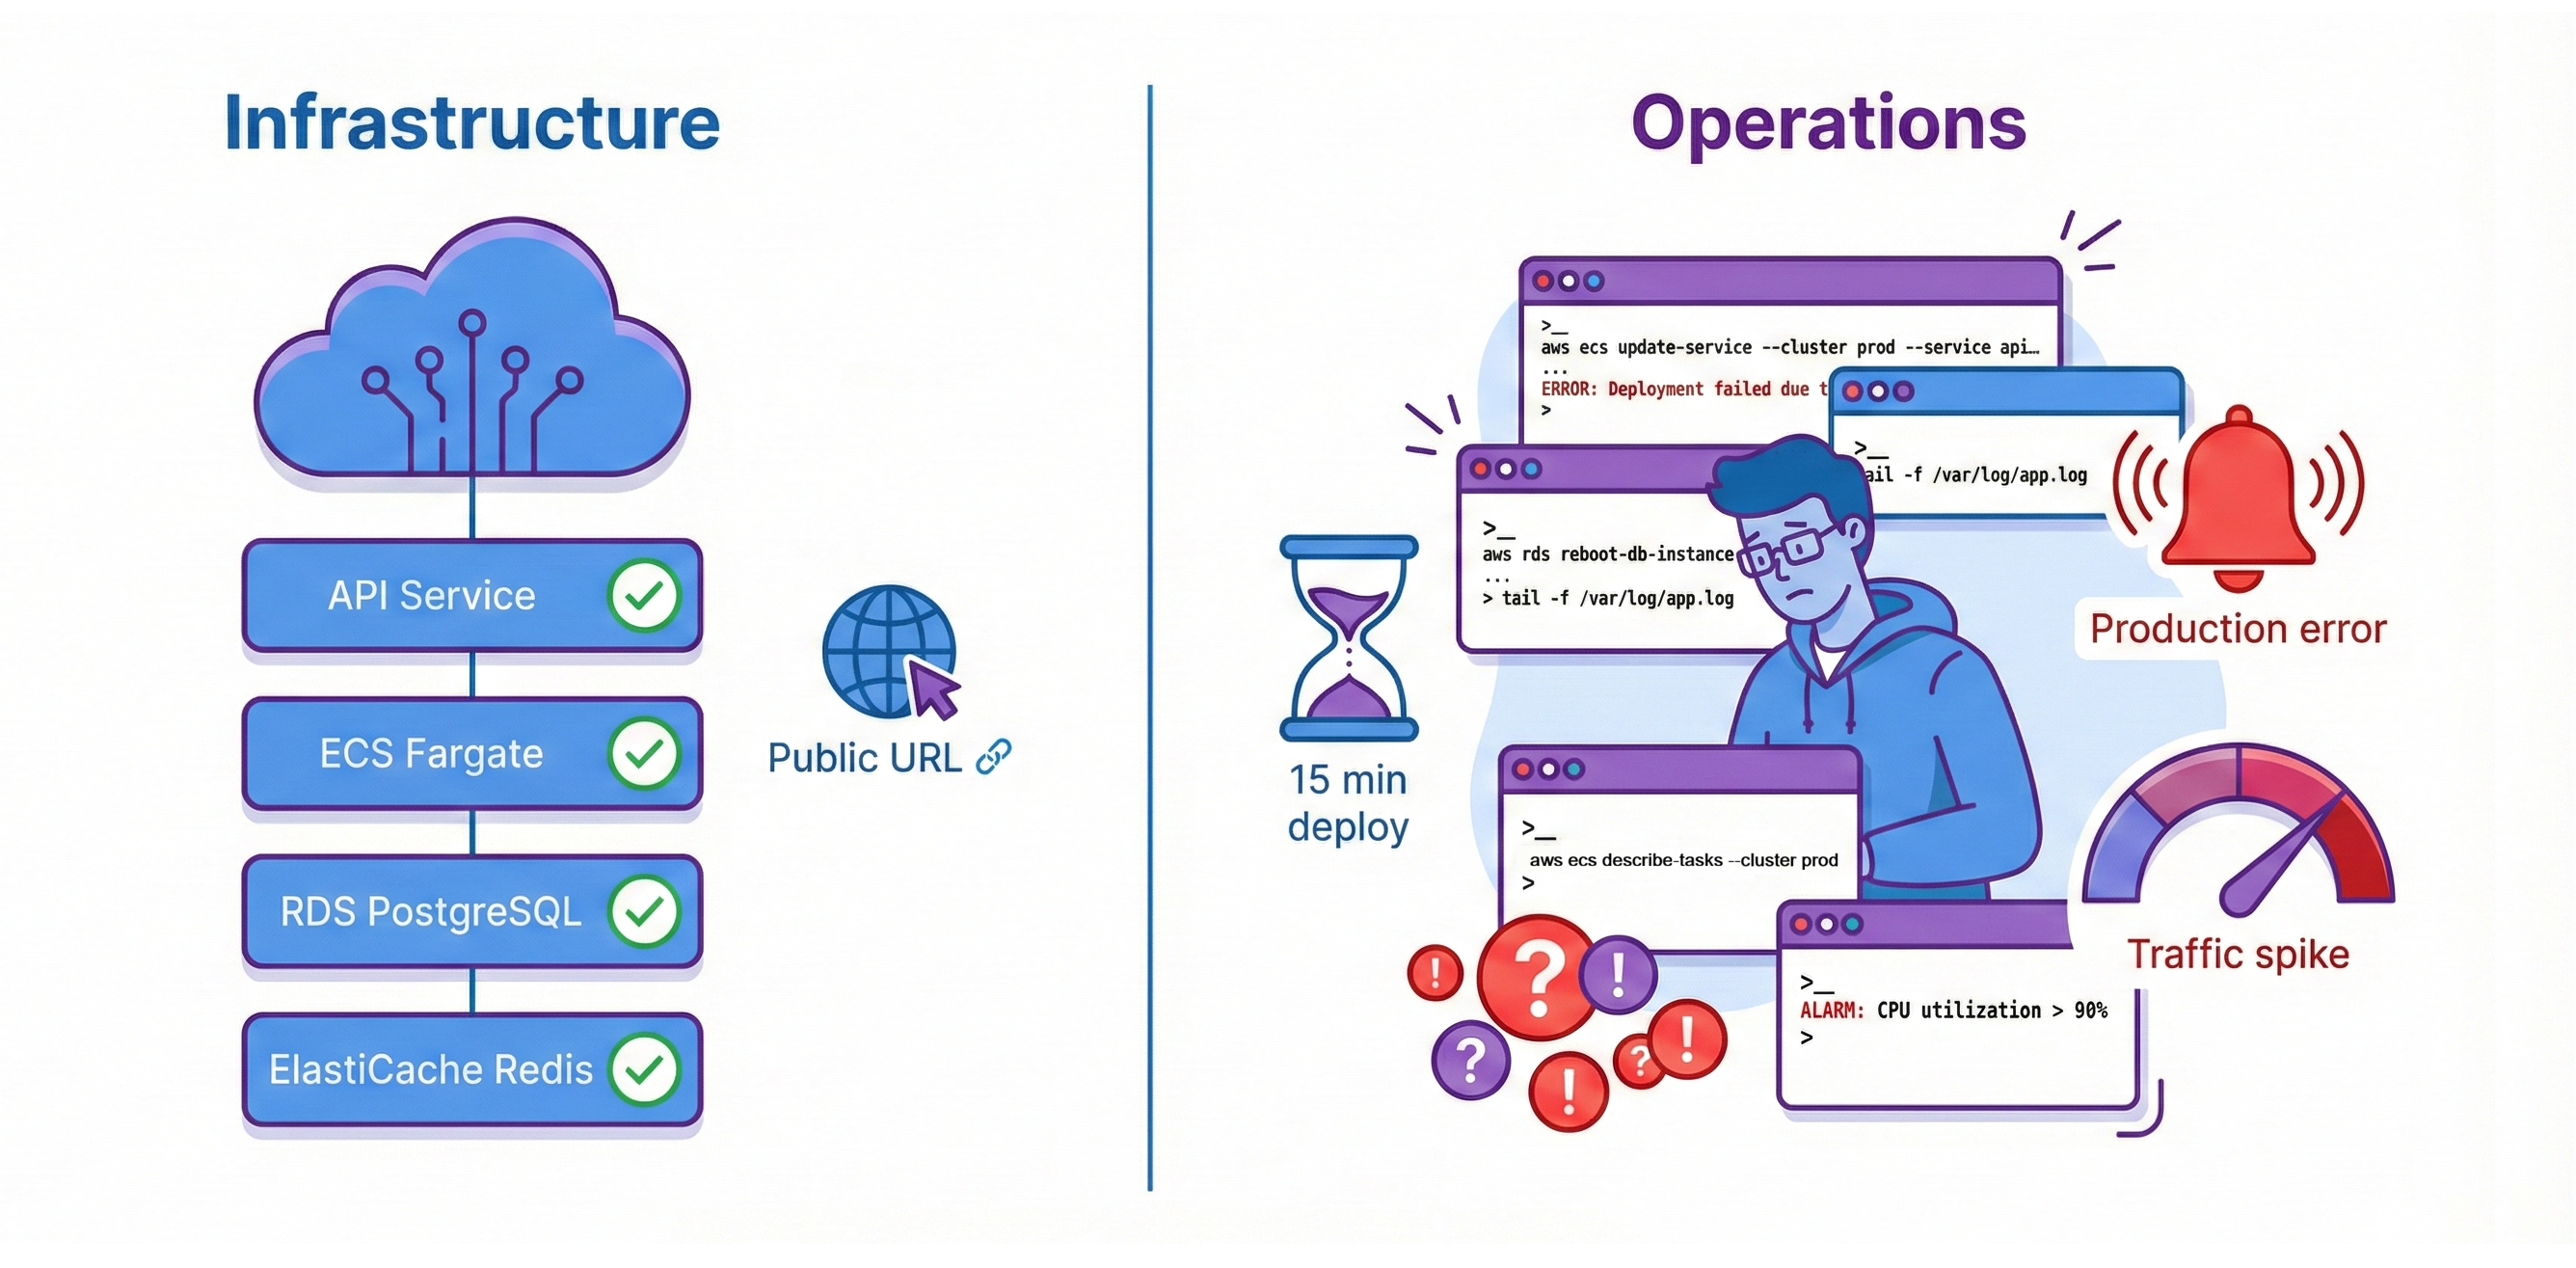
Your News Aggregator API is deployed on AWS. It serves requests at a public URL. RDS PostgreSQL and ElastiCache Redis provide managed persistence. ECS Fargate runs your containers. The infrastructure works perfectly. But every code change requires 15 minutes of manual AWS CLI commands. Without monitoring, the only alerting system you have is your users, and they’re always the last to know. Traffic spikes overwhelm your fixed two-container capacity. You have deployment, but you don't have operations.

Diagram titled 'Deployment vs Operations'. On the left, a stable cloud stack shows API Service, ECS Fargate, RDS PostgreSQL, and ElastiCache Redis with green checkmarks and a public URL. On the right, a stressed engineer is surrounded by AWS CLI terminal windows, a 15-minute deploy hourglass, production error alerts, and a traffic spike gauge.
Your infrastructure is healthy and deployed, but manual scripts, missing alerts, and fixed capacity mean you still lack real operations.

Deployment is necessary but not sufficient. Getting code running in production is the first milestone. Operating that code reliably at scale is the second. Professional engineers own the complete lifecycle: write code, test it, deploy it, monitor it, debug it when it breaks, optimize costs, and improve it continuously. This end-to-end ownership is what "DevOps culture" means—and it's what this chapter teaches.

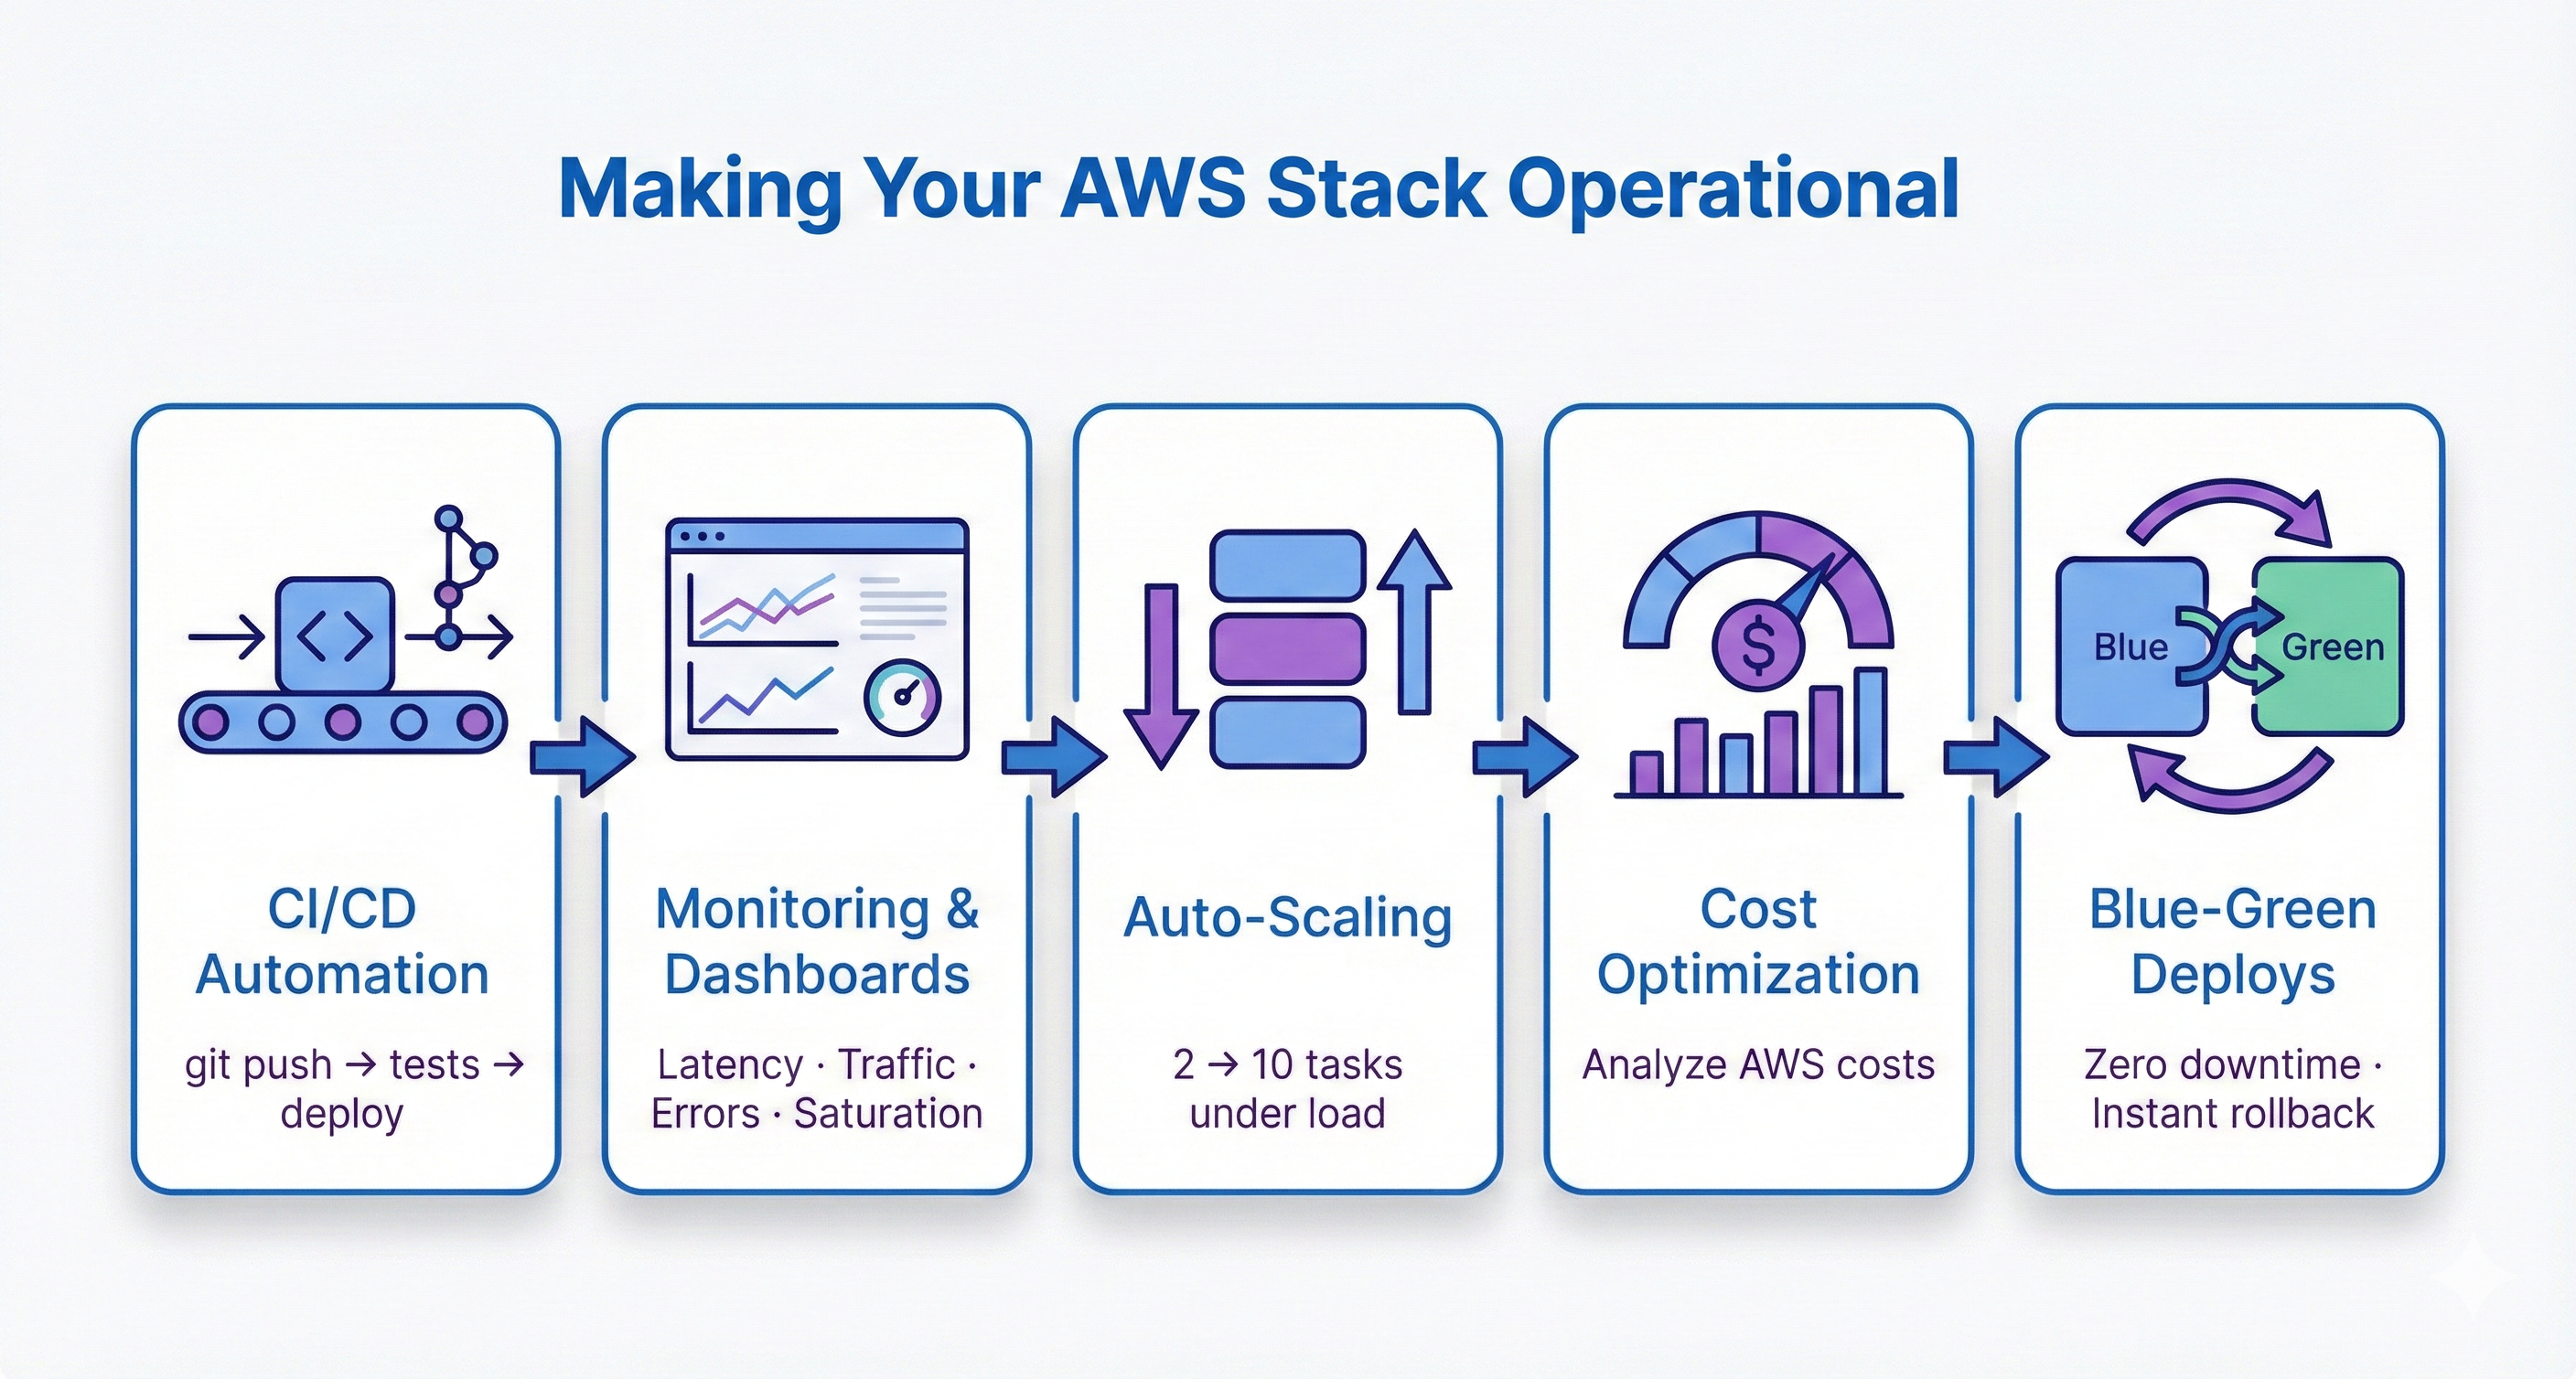
Chapter 28 built your AWS infrastructure. Chapter 29 makes it operational. You'll add CI/CD automation so git push deploys automatically after tests pass. You'll implement CloudWatch monitoring with dashboards tracking latency, traffic, errors, and resource saturation. You'll configure auto-scaling policies that grow your infrastructure from 2 containers to 10 containers under load, then scale back down when traffic subsides. You'll analyze AWS costs service-by-service and optimize your monthly bill. You'll implement blue-green deployment strategies for zero-downtime updates with instant rollback capability.

Diagram titled 'Making Your AWS Stack Operational' showing a horizontal row of five cards: CI/CD automation, monitoring and dashboards, auto-scaling, cost optimization, and blue-green deployments, all connected by arrows to show the operations capabilities added in this chapter.
In this chapter you add CI/CD, monitoring, auto-scaling, cost controls, and blue-green deployments to turn basic AWS deployment into full operations.

By the end, you'll operate production infrastructure professionally. When recruiters ask "How do you deploy code?", you'll explain your GitHub Actions CI/CD pipeline with quality gates. When they ask "How do you monitor production?", you'll discuss CloudWatch dashboards with Golden Signals. When they ask "How does your system scale?", you'll describe auto-scaling policies responding to CPU metrics in 60-90 seconds. This operational expertise separates developers who can deploy from engineers who can operate systems at scale. That's the career transformation this chapter enables.

Chapter Roadmap

This chapter transforms your Chapter 28 AWS deployment into a professionally operated production system. You'll progress from understanding operations principles through hands-on automation, monitoring, scaling, and incident response.

1

Production Operations Foundations

Sections 1–2 • Conceptual Foundation

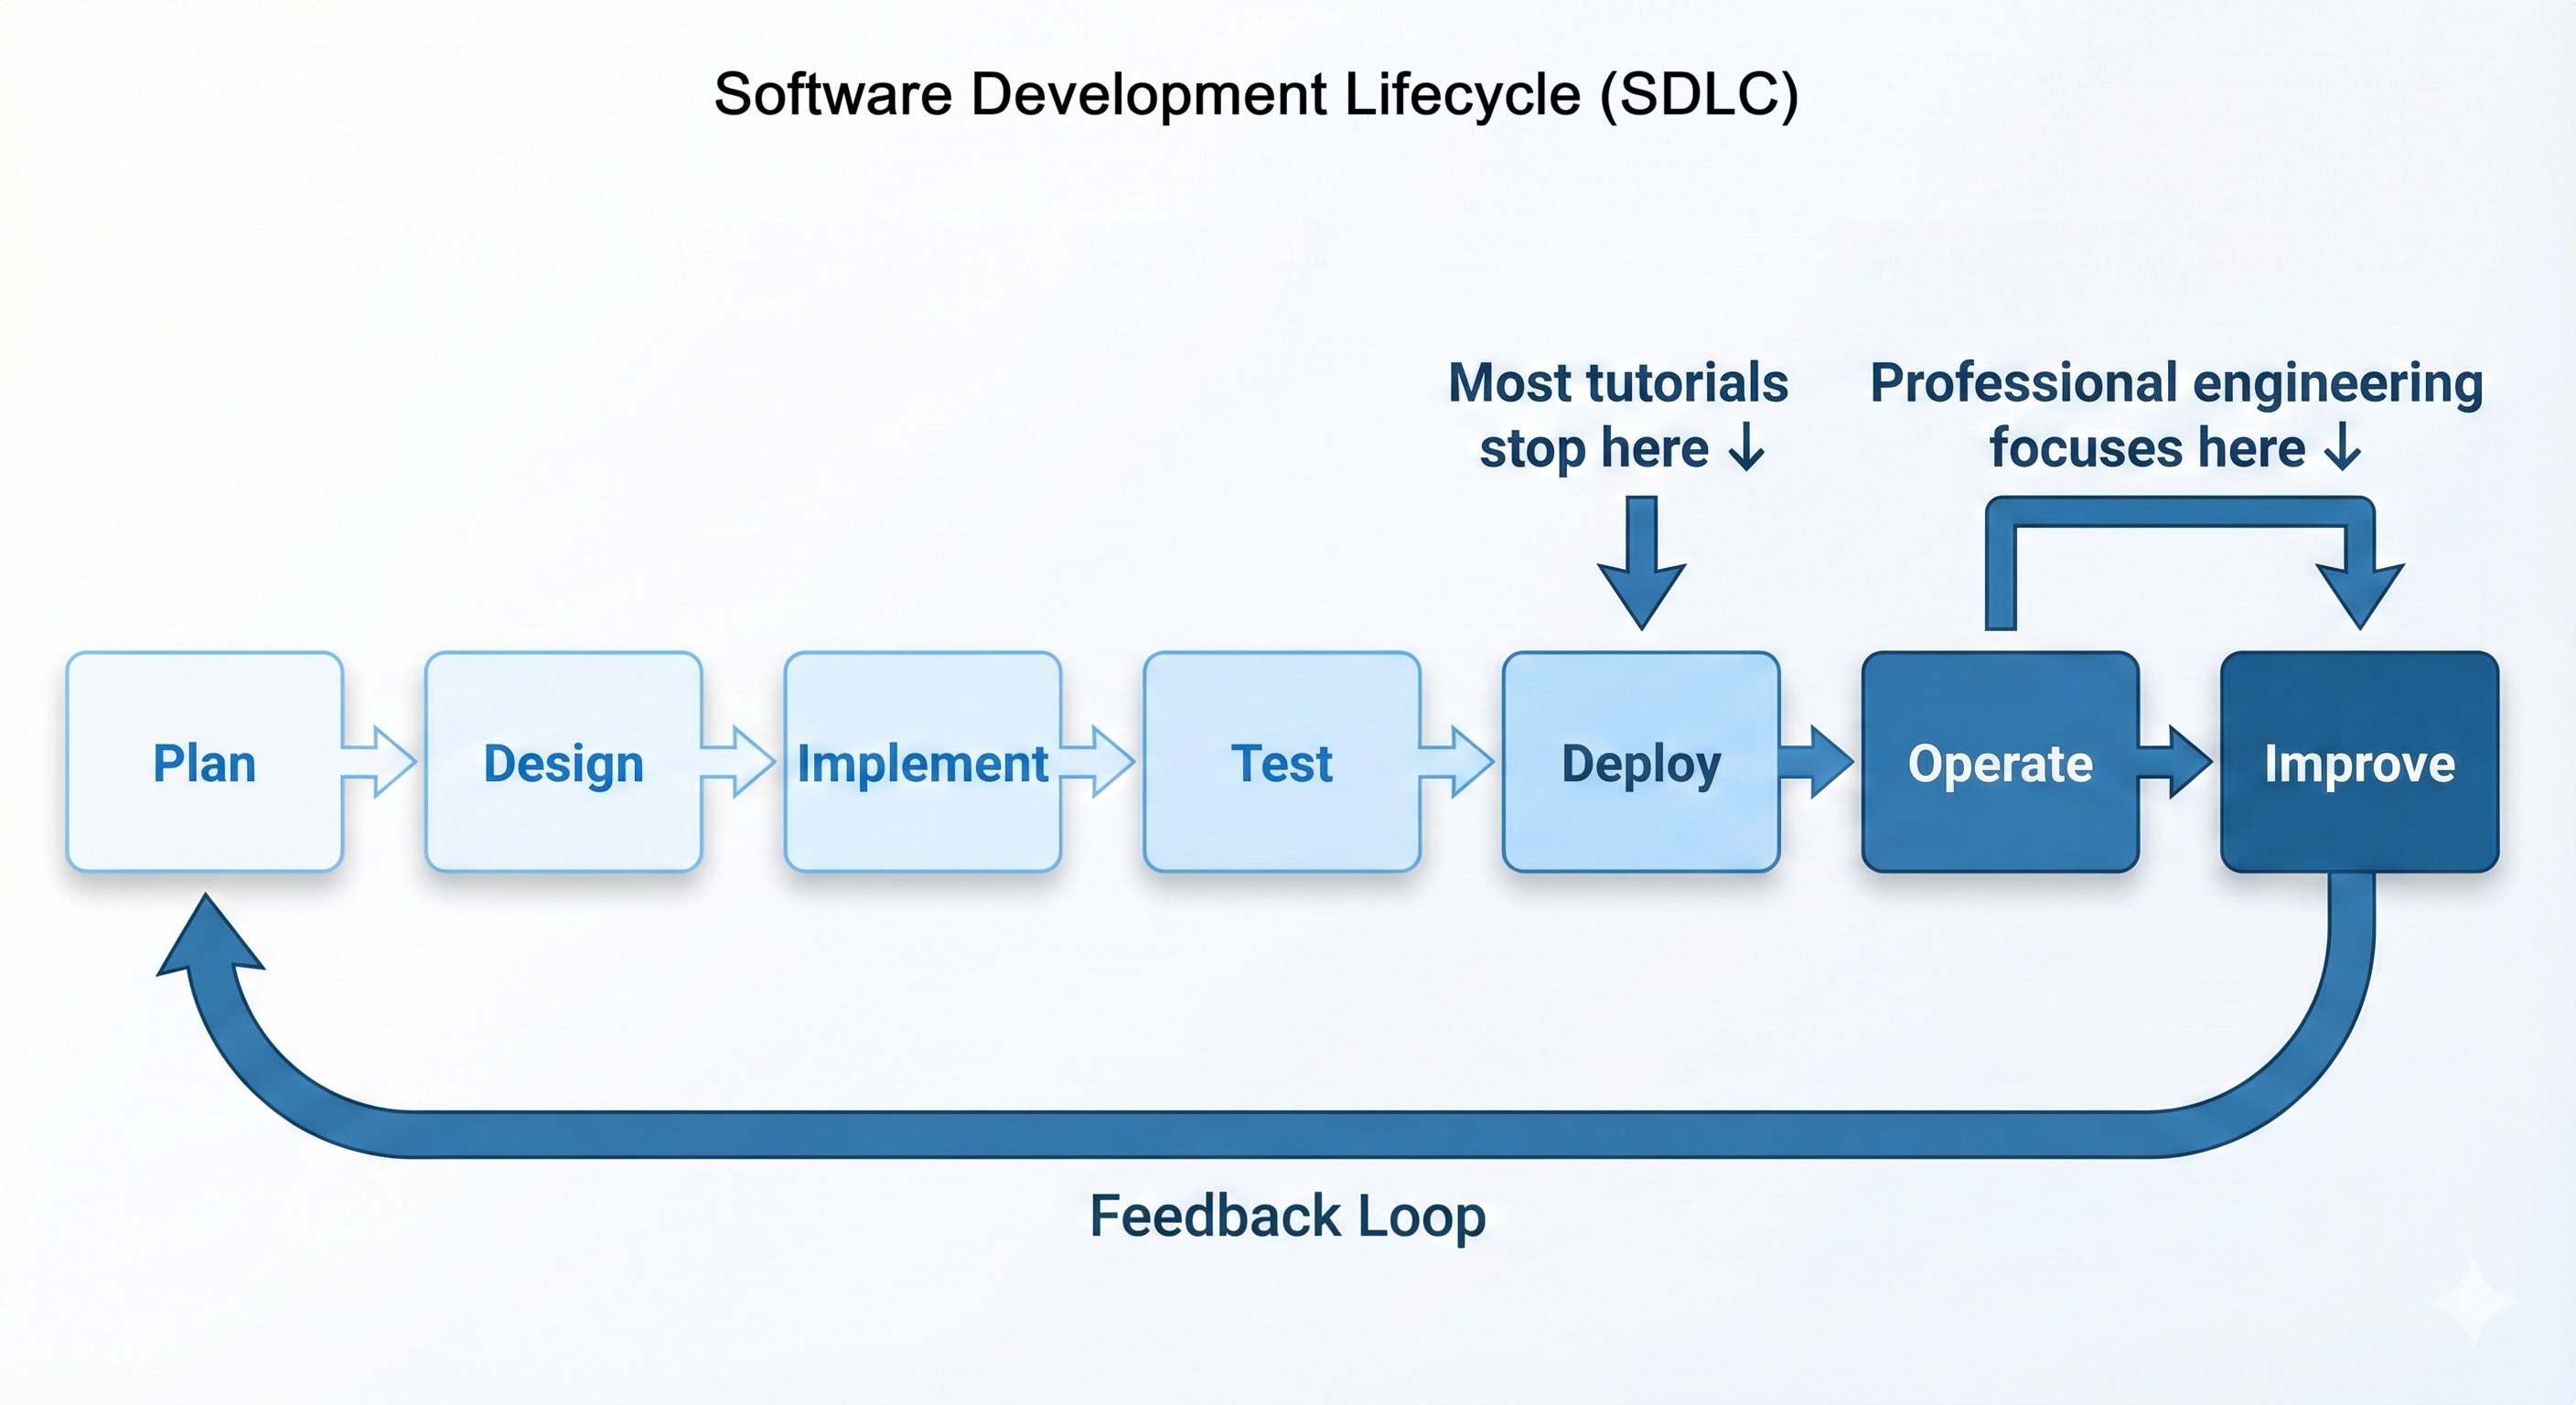
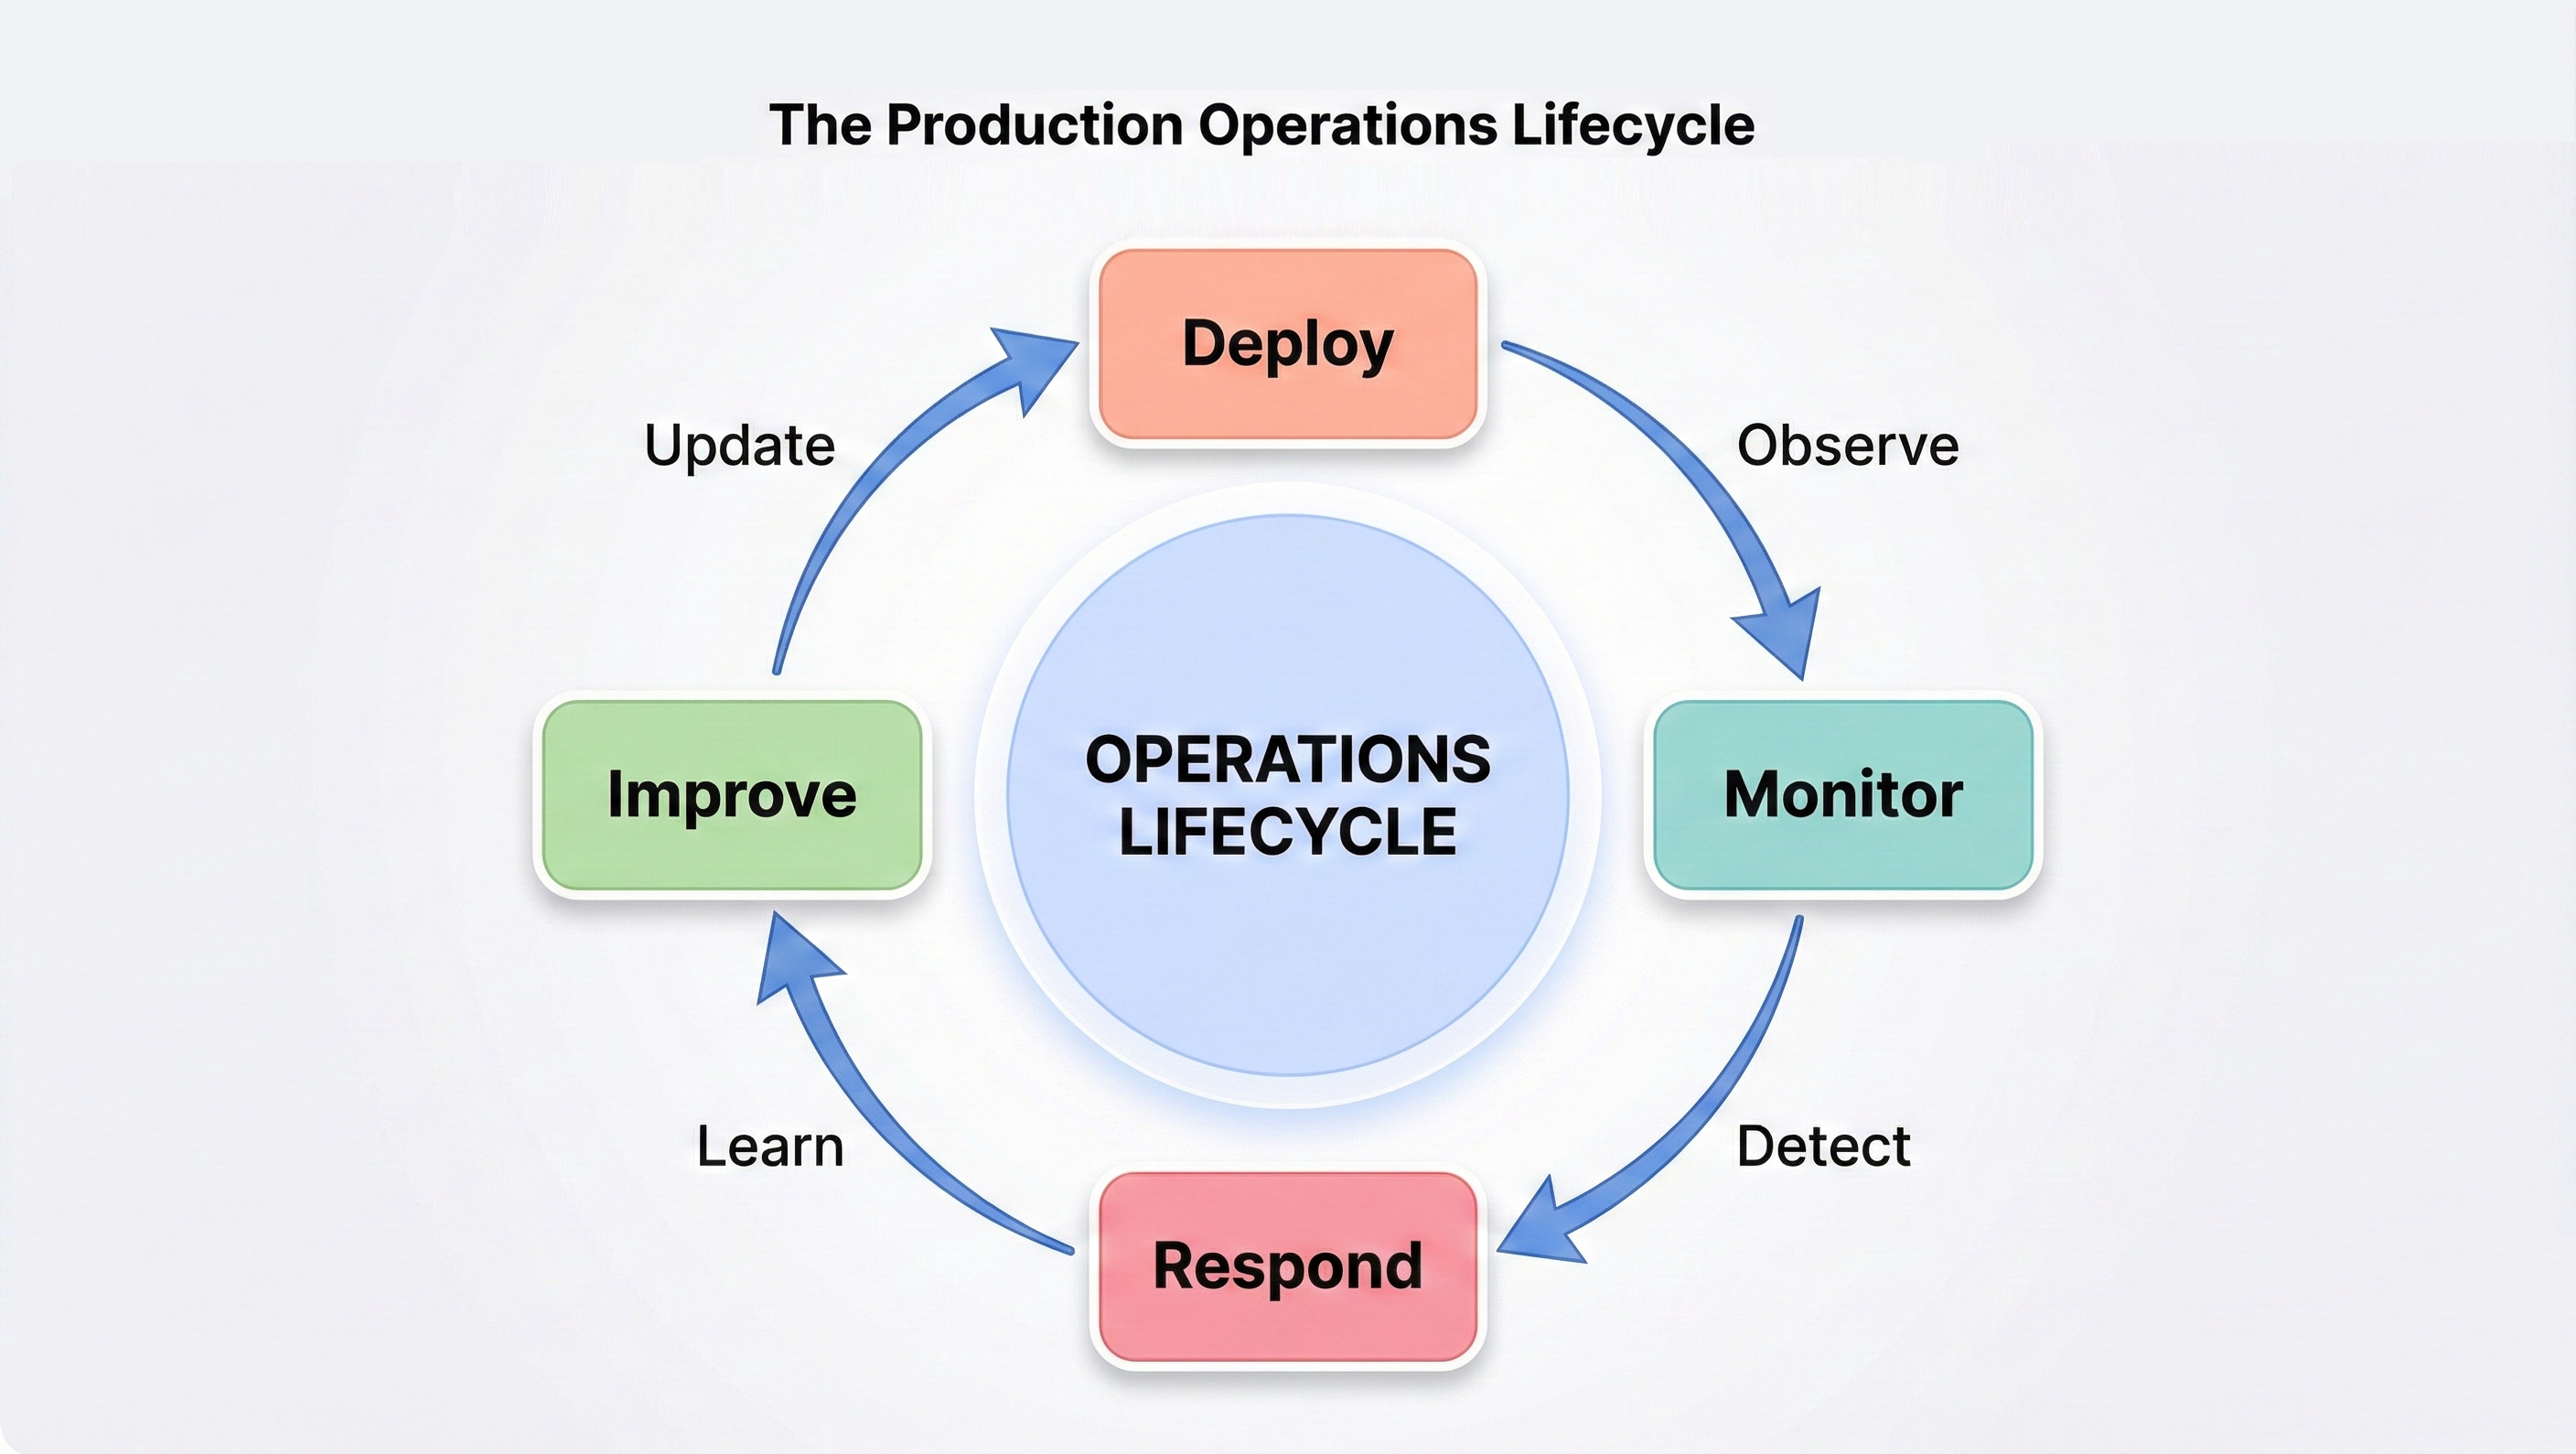
Understand the gap between deployment and operations. Learn the Software Development Lifecycle (SDLC), the production operations lifecycle, and the key metrics that define system health. Explore the "operations as code" philosophy that underpins everything that follows.

DevOps Culture SDLC Operations Metrics
2

CI/CD Pipeline with GitHub Actions

Section 3 • Automation

Build a complete CI/CD pipeline so that every git push triggers automated tests, Docker image builds, and ECS deployments. Configure secure AWS credential management with OIDC and implement quality gates that prevent broken code from reaching production.

GitHub Actions OIDC Docker Build ECS Deploy
3

CloudWatch Monitoring and Observability

Section 4 • Observability

Implement the Golden Signals framework—latency, traffic, errors, and saturation—using CloudWatch dashboards, alarms, and Logs Insights queries. Move from flying blind to full production visibility with automated alerting before users notice problems.

Golden Signals CloudWatch Dashboards Alarms Logs Insights
4

Auto-Scaling and Cost Optimization

Sections 5–6 • Elastic Infrastructure

Configure ECS auto-scaling policies that grow your infrastructure from 2 to 10 containers under load and shrink back when traffic subsides. Analyze AWS costs service-by-service and implement optimization strategies that reduce your monthly bill without sacrificing reliability.

Target Tracking Load Testing Cost Analysis Right-Sizing
5

Deployment Patterns, Incident Response, and Security

Sections 7–9 • Production Hardening

Learn blue-green and canary deployment strategies for zero-downtime releases. Build incident response runbooks with severity classification and systematic debugging workflows. Harden your stack with container security, secrets rotation, and network security auditing.

Blue-Green Deploys Incident Response SecOps Runbooks

Before You Begin: What You Should Already Have

In Chapter 28 you deployed your News API to AWS using ECS Fargate, RDS PostgreSQL, ElastiCache Redis, and an Application Load Balancer. That chapter gave you working production infrastructure. This chapter assumes that infrastructure is already in place and healthy.

Diagram titled 'Chapter 28 Infrastructure Completed'. A developer laptop with AWS CLI configured pushes Docker images to GitHub and Amazon ECR, which feeds an ECS Fargate service running two tasks behind an Application Load Balancer. The service connects to RDS PostgreSQL, ElastiCache Redis, and CloudWatch Logs, with green checkmarks on each component and a banner reading 'Ready for Automation & Monitoring'.
Your Chapter 28 deployment is complete: ECS, load balancer, managed databases, and logging are in place. This is the starting point for the automation and monitoring work in this chapter.

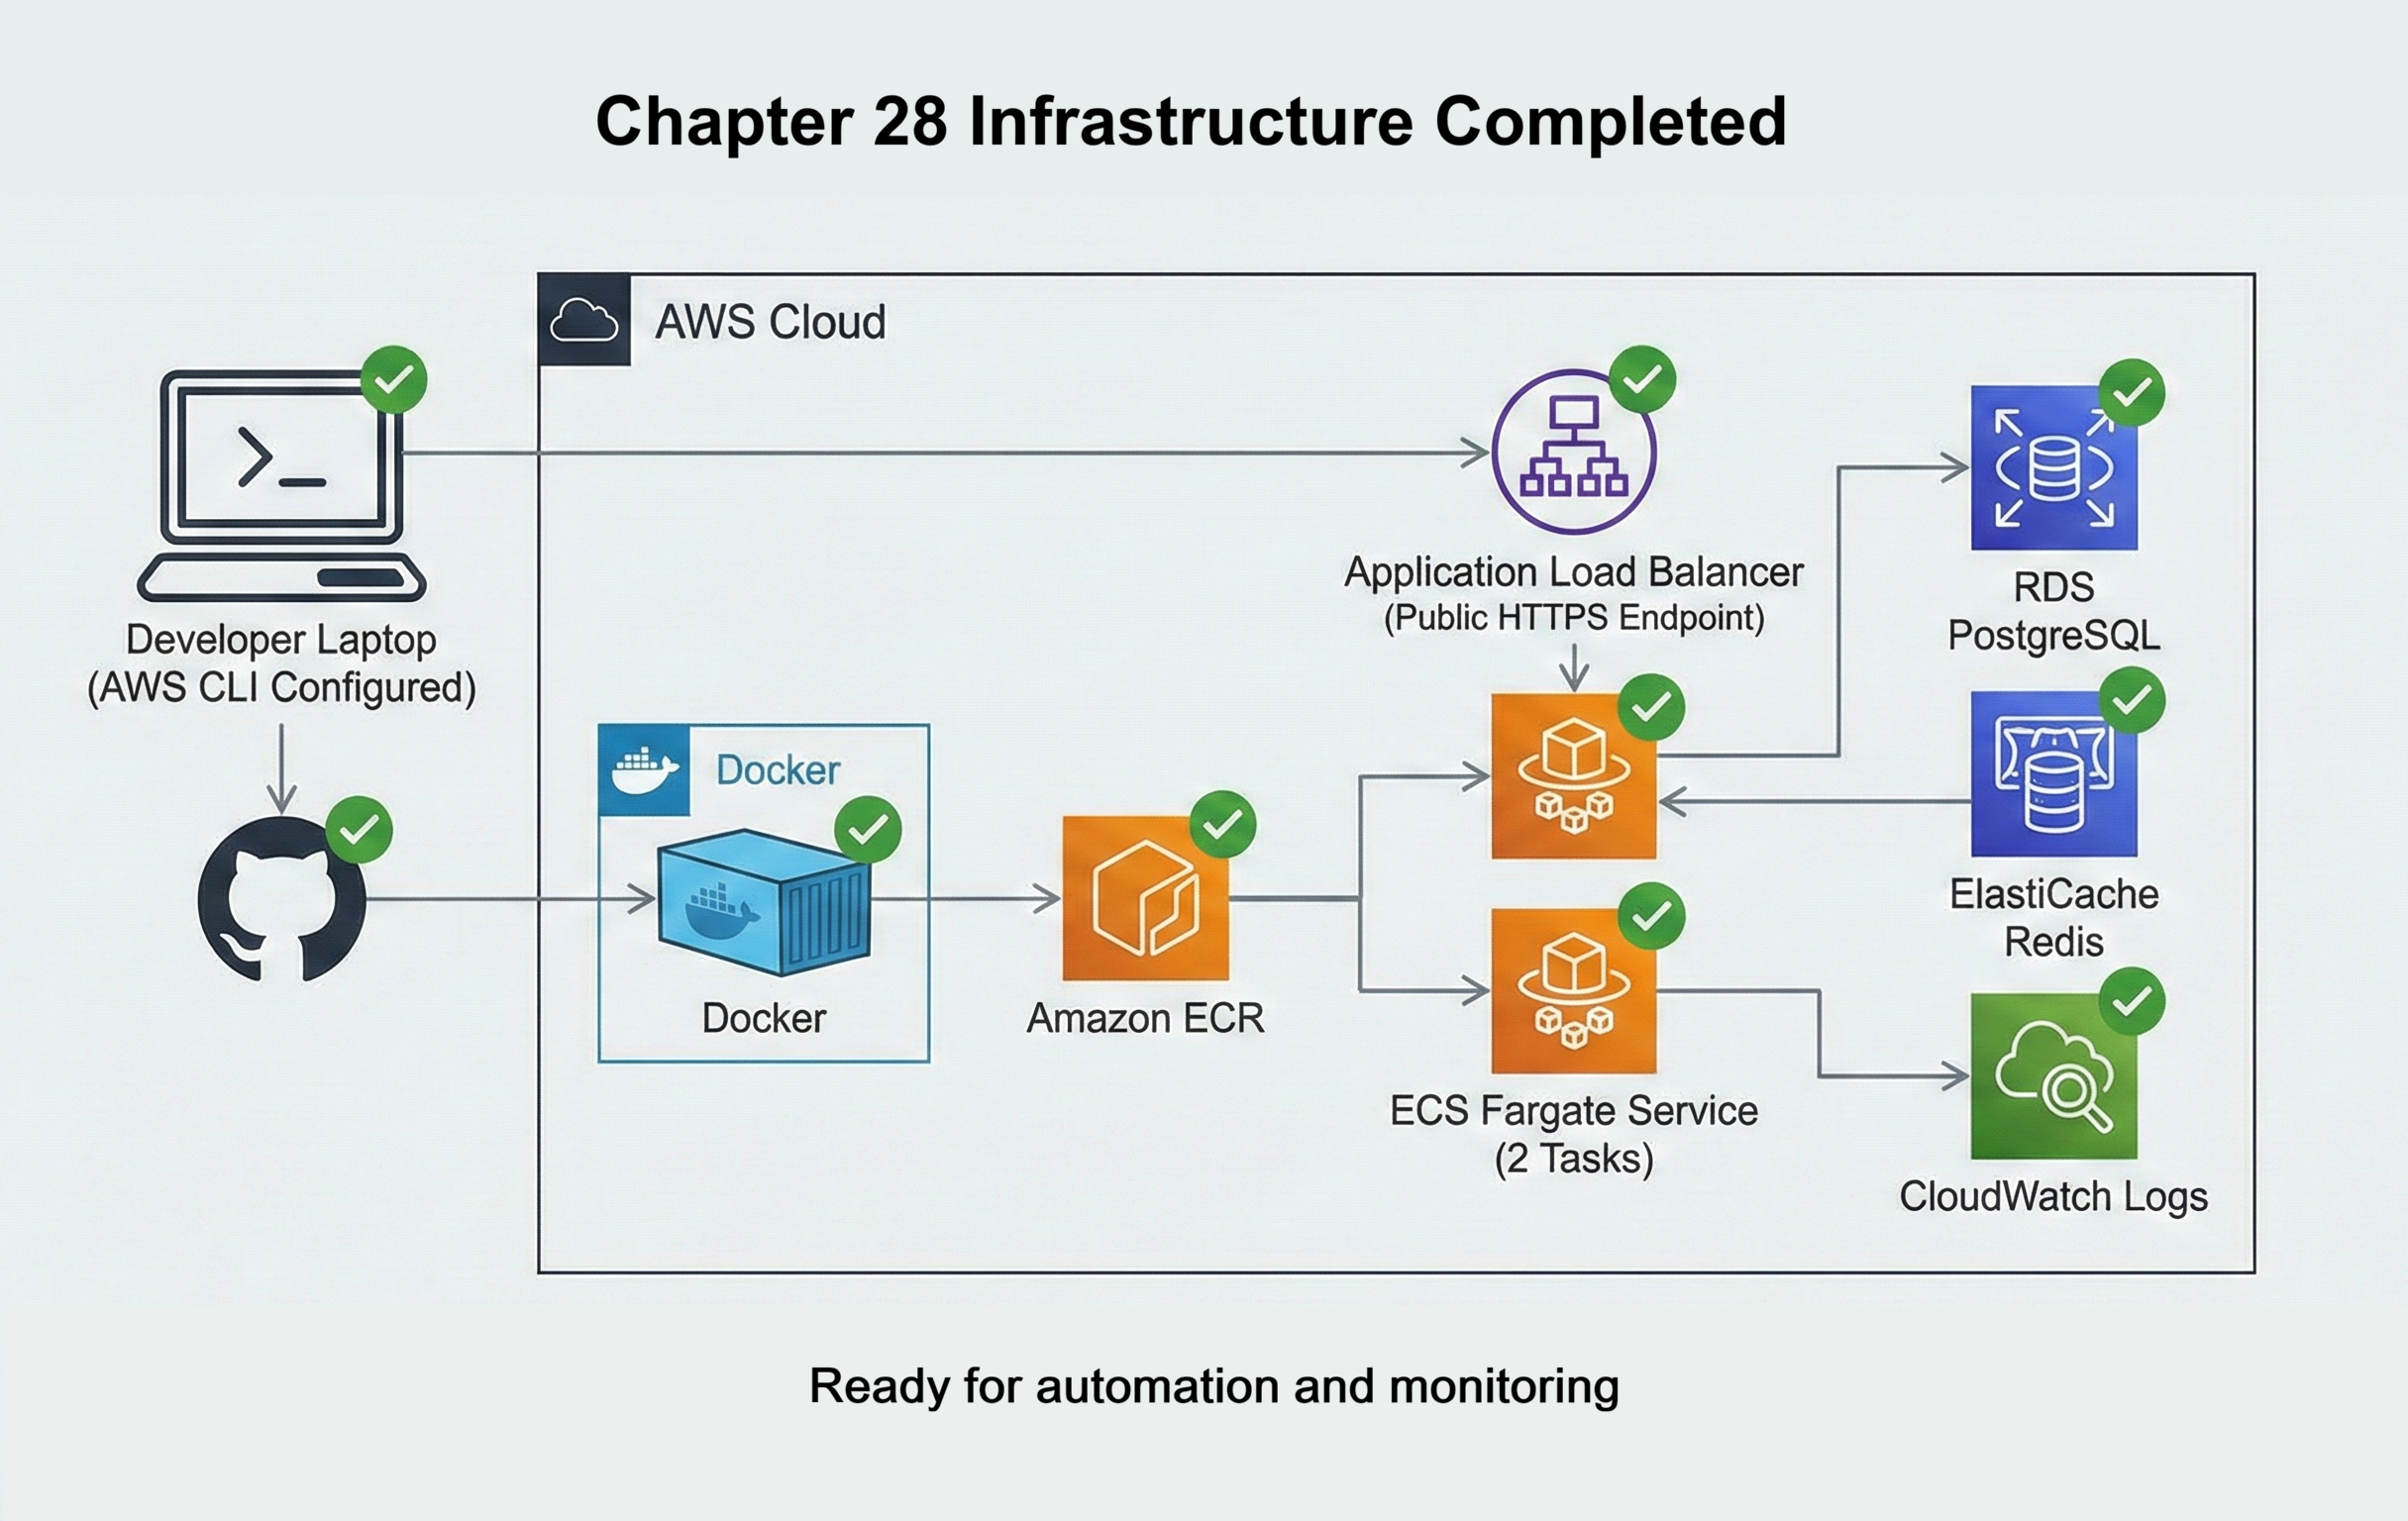
Before you continue, make sure you have:

  • Running ECS service: An ECS Fargate service that is running at least two tasks for your News API, with a working task definition and task execution role.
  • Public HTTPS endpoint: An Application Load Balancer that forwards HTTPS traffic to your ECS service, so your API is reachable at a public URL.
  • Managed data services: RDS PostgreSQL and ElastiCache Redis instances that your containers can reach and use successfully for storage and caching.
  • Container registry in ECR: A working ECR repository that stores your News API Docker images, and a process from Chapter 28 that can push images to it.
  • CloudWatch logging turned on: ECS tasks that send application logs to CloudWatch Logs so you can already see log streams for your running containers.
  • GitHub repository: Your News API code hosted on GitHub, using the same Dockerfile and configuration you used for the initial deployment.
  • AWS access from your laptop: AWS CLI configured with credentials that can interact with your account, created in Chapter 28 when you set up IAM.

If any of these pieces are missing or not working yet, pause here and return to Chapter 28. Once your base deployment is stable, you are ready for this chapter, where you will automate deployment, add monitoring, configure auto-scaling, control costs, and roll out changes safely in production.

The Operations Gap

Deploying code and operating systems are fundamentally different disciplines. Deployment means getting your application running somewhere. Operations means keeping it running reliably, monitoring its behavior, responding to failures, optimizing costs, and safely deploying improvements. Most tutorials teach deployment and stop there. Professional engineers are judged not by whether they can deploy code, but by whether they can keep systems healthy once they’re live.

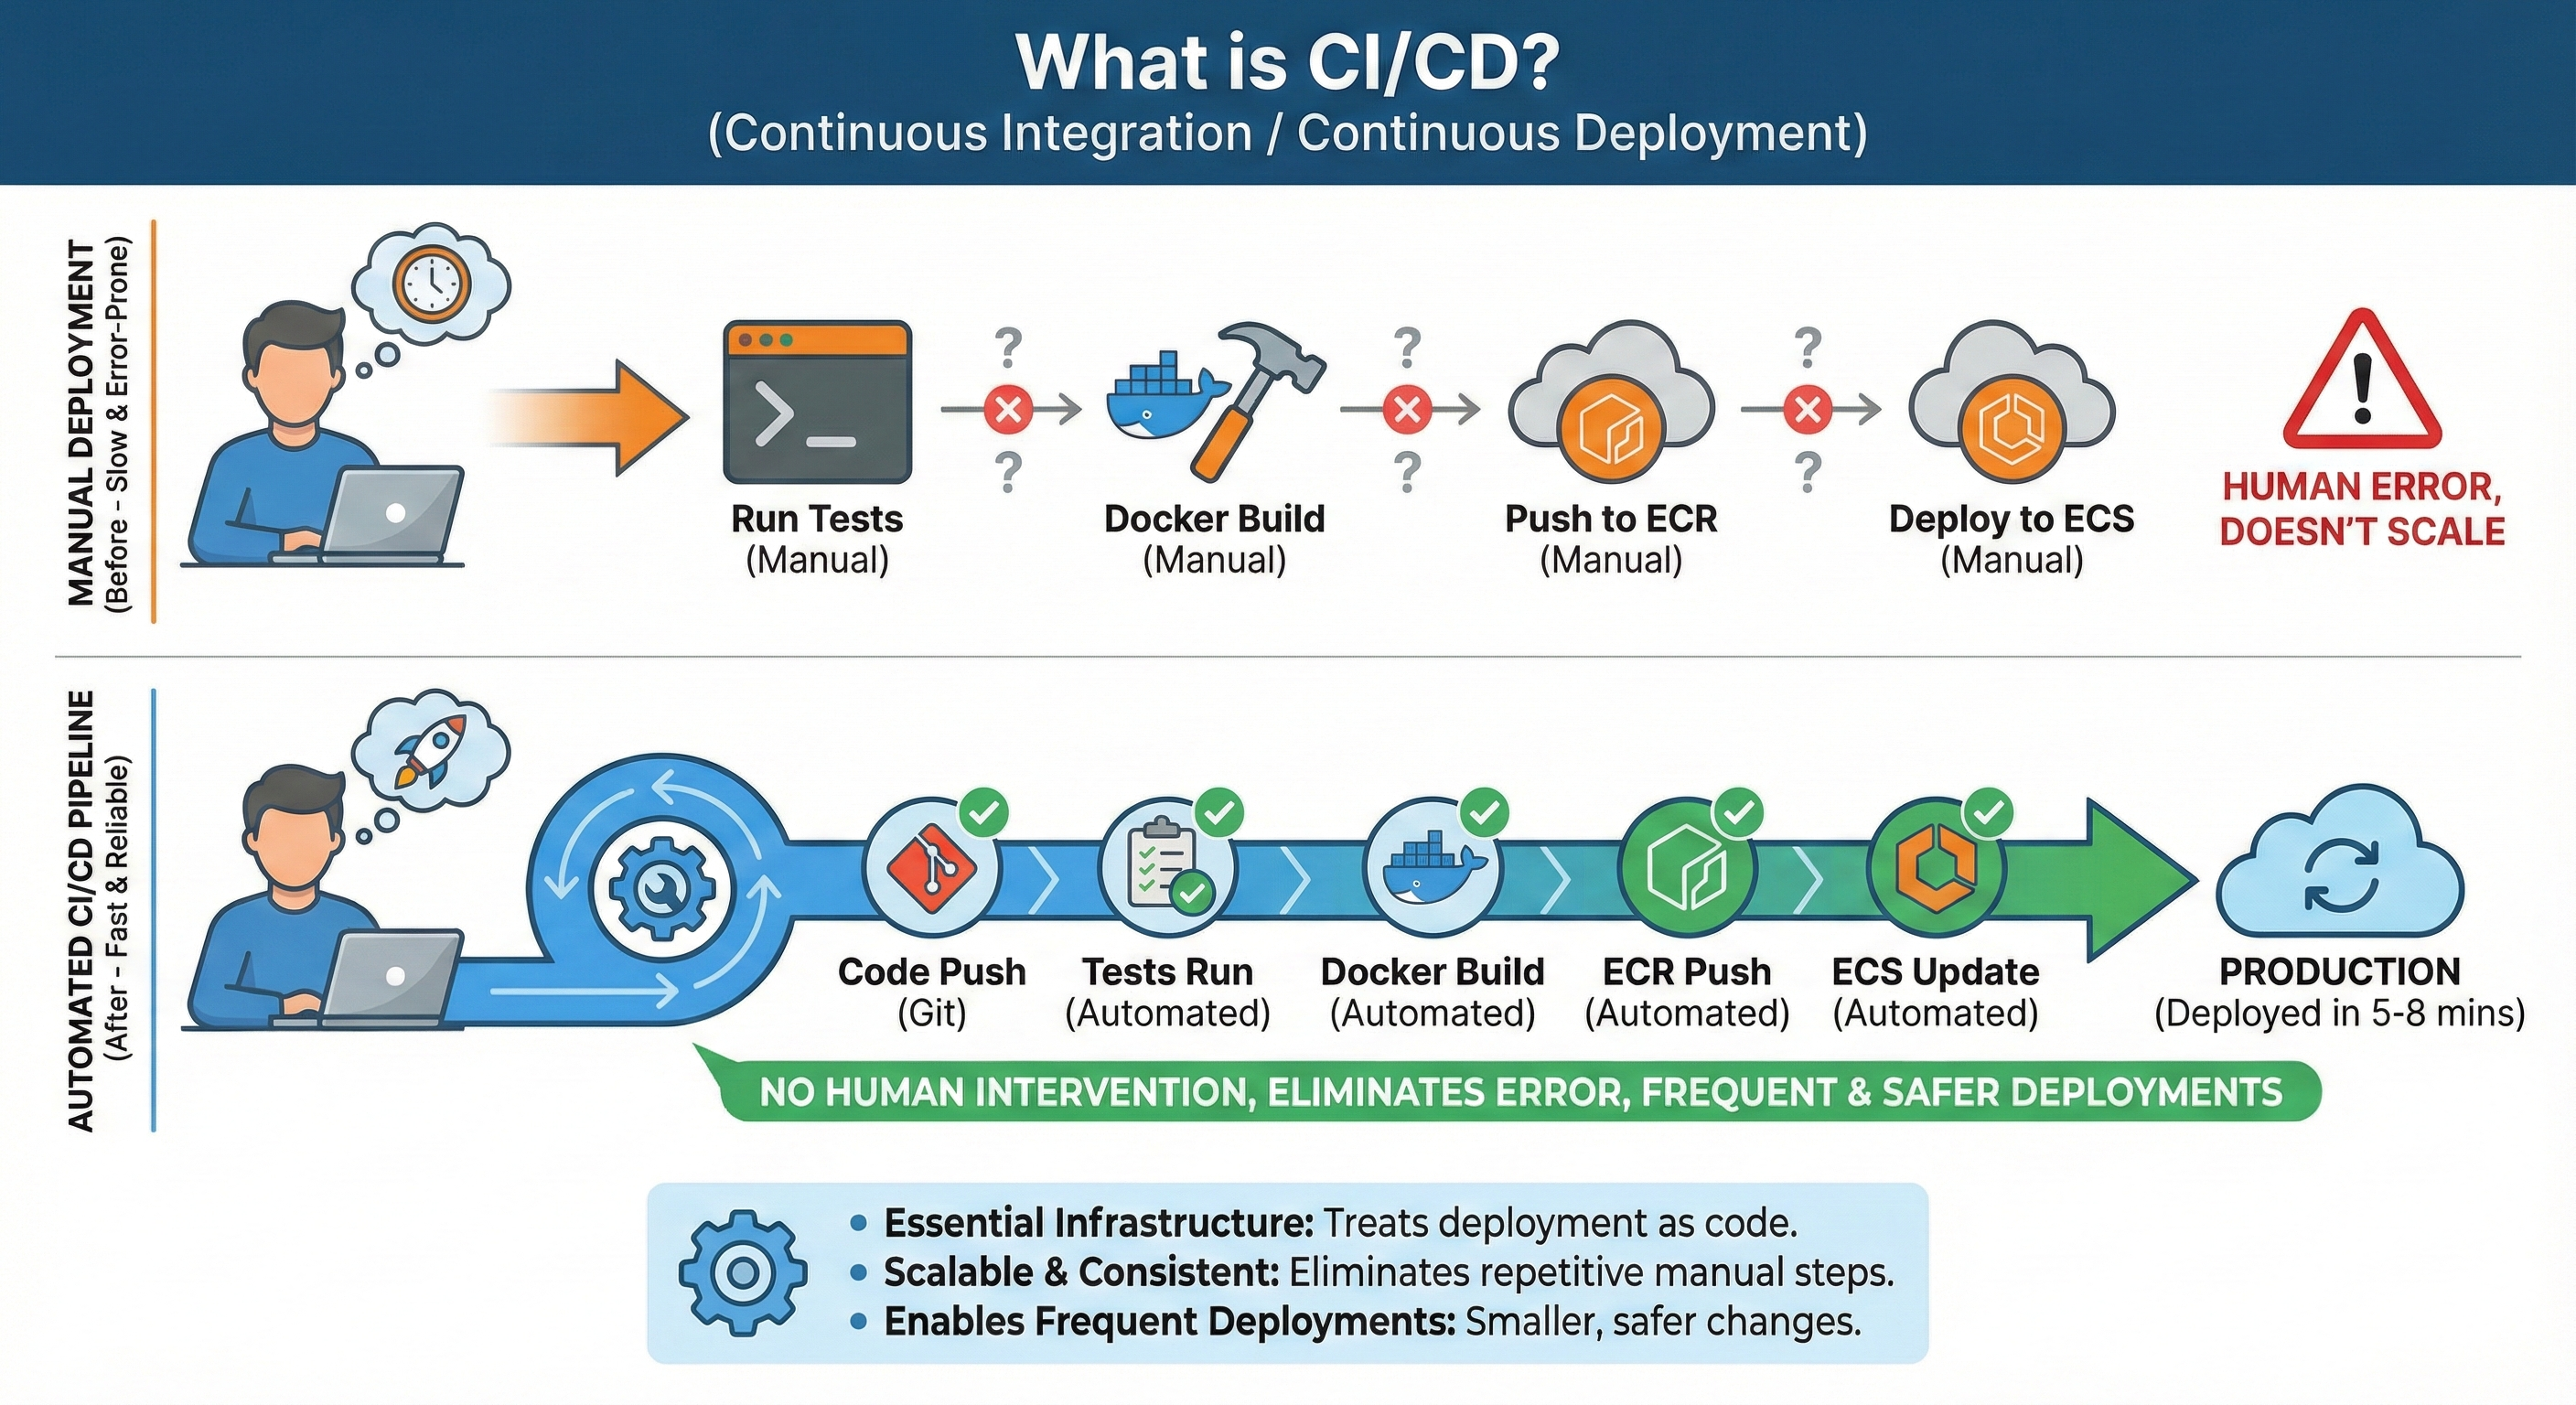
Manual deployment doesn't scale.

Manually updating task definitions with AWS CLI works once. By the tenth deployment, you're spending hours on repetitive steps that can fail at any point. By the hundredth deployment across a team of developers, manual processes create chaos. Professional teams automate deployment: code changes trigger tests automatically, successful tests trigger Docker builds automatically, new images deploy automatically with rollback capability. This automation is CI/CD, and it's non-negotiable at scale.

Production is invisible without monitoring.

Your containers are running. Are they serving requests in under 200ms? Are they returning 500 errors for some endpoints? Is CPU at 90% capacity? A service might look healthy in ECS while quietly returning 5% 500 errors because the database is saturated—without monitoring, you have no way to see that pattern. Professional operations means comprehensive observability: logs from all containers in one place, metrics tracking system health, alarms notifying you before users notice issues. CloudWatch provides these capabilities, but you need to implement them intentionally.

Fixed capacity wastes money and fails under load.

Two containers handle normal traffic perfectly. During traffic spikes, two containers can't keep up—response times degrade, errors rise, and users feel it immediately. During low-traffic periods, those same containers sit mostly idle and you're paying for capacity you don't need. This is the opposite of what cloud infrastructure is designed for: elasticity. Auto-scaling solves both problems by adding capacity when needed and removing it when not. This elasticity is what makes cloud infrastructure economically efficient.

DevOps Culture: You Build It, You Run It

Traditional software organizations separate development and operations teams. Developers write code and throw it over the wall to operations. Operations teams deploy it, monitor it, and handle incidents—often without understanding the code. This separation creates misaligned incentives: developers optimize for feature velocity, operations teams optimize for stability. The two goals conflict.

DevOps culture eliminates this separation. The same engineers who write code also deploy it, monitor it, debug production issues, and carry pagers for on-call rotations. This unified ownership aligns incentives: engineers who handle 3am production incidents suddenly care deeply about error handling, logging, and monitoring. They build systems that are easier to operate because they're the ones operating them. This chapter teaches that mindset.

The Solution: Operational Automation

Professional operations eliminates these gaps through three pillars of automation: automated deployment (CI/CD), comprehensive monitoring (observability), and elastic infrastructure (auto-scaling). This chapter teaches you to implement all three, transforming your Chapter 28 deployment from basic infrastructure into production-grade operations.

Pillar 1: Automated Deployment with CI/CD

Every code change you push triggers an automated pipeline: tests run automatically, Docker images build automatically, and deployments happen automatically. This automation eliminates the 15 minutes of manual AWS CLI commands you currently run for each deployment. More importantly, it prevents entire categories of human error—forgotten tests, wrong image tags, skipped deployment steps. When deployment becomes automated and boring, teams deploy dozens of times per day safely.

Section 3 teaches Continuous Integration/Continuous Deployment (CI/CD) using GitHub Actions. You'll build a complete pipeline that deploys your News API automatically on every git push.

Pillar 2: Comprehensive Monitoring with CloudWatch

Your containers are running, but you can't see what they're doing. Are requests completing in 200ms or 2 seconds? Are 5% of requests returning errors? Is CPU at 30% or 95%? Without monitoring, the first sign of problems is users complaining. CloudWatch makes production visible by collecting logs from all containers in one place and tracking metrics that reveal system health. Alarms notify you when metrics cross thresholds, detecting problems before users notice them.

Section 4 teaches CloudWatch monitoring using the Golden Signals framework: latency, traffic, errors, and saturation. You'll create dashboards visualizing system health, configure alarms for production issues, and learn to debug incidents using log queries.

Pillar 3: Elastic Capacity with Auto-Scaling

Your News API currently runs exactly 2 containers continuously—during 3am when traffic is minimal and during traffic spikes when 2 containers can't keep up. This fixed capacity wastes money during quiet periods and fails users during peaks. Auto-scaling solves both problems by adjusting container count automatically based on load. Your infrastructure grows from 2 containers to 10 containers when CPU rises above 70%, then shrinks back to 2 when load subsides. You only pay for extra capacity while you're using it.

Section 5 teaches Application Auto Scaling for ECS. You'll configure policies that maintain target CPU utilization, test scaling behavior with load tests, and calculate cost savings compared to fixed capacity.

Diagram comparing manual deployment versus automated CI/CD pipeline. Top half shows manual deployment: developer thinking about time, running tests manually, building Docker manually, pushing to ECR manually, deploying to ECS manually, with red X marks showing error-prone steps and warning 'HUMAN ERROR, DOESN'T SCALE'. Bottom half shows automated CI/CD pipeline: developer relaxed after code push, automated gear system running tests, Docker build, ECR push, and ECS update with green checkmarks, resulting in production deployment in 5-8 minutes. Bottom banner reads: 'NO HUMAN INTERVENTION, ELIMINATES ERROR, FREQUENT & SAFER DEPLOYMENTS' with benefits listed: Essential infrastructure, Scalable & Consistent, Enables Frequent Deployments.
CI/CD automates deployment (Section 3), monitoring reveals system behavior (Section 4), and auto-scaling provides elastic capacity (Section 5). Together, these transform basic deployment into production operations.

By the end of this chapter, you'll have implemented all three pillars. Your News API will deploy automatically on git push, provide real-time visibility into production health, and scale from 2 to 10 containers based on demand. This operational maturity separates developers who can deploy code from engineers who can operate systems reliably at scale.

Learning Objectives

What You'll Master in This Chapter

By the end of this chapter, you'll be able to:

  • Build complete CI/CD pipelines with GitHub Actions that test, build, and deploy automatically on every git push
  • Implement comprehensive production monitoring using CloudWatch with the Golden Signals framework: latency, traffic, errors, and saturation
  • Configure auto-scaling policies that adjust container count dynamically based on CPU utilization and custom metrics
  • Analyze AWS costs service-by-service and implement optimization strategies reducing monthly bills by 40-70%
  • Deploy blue-green and canary deployment strategies for zero-downtime updates with instant rollback capability
  • Debug production issues systematically using CloudWatch Logs Insights to query logs across all containers
  • Implement security operations practices including container scanning, secrets rotation, and least-privilege access controls
  • Discuss production operations confidently in technical interviews with concrete examples from your deployed News API

2. Understanding Production Operations

Operations means keeping systems running reliably in production. It's everything that happens after deployment: monitoring health, responding to incidents, deploying updates safely, optimizing performance, managing costs, and planning capacity. Operations is not a one-time task; it's an ongoing discipline for the entire lifetime of your application.

In traditional software organizations, operations was a separate team. Developers wrote code, operations teams deployed it and kept it running. This separation created problems: developers optimized for feature velocity without considering operational complexity, operations teams managed systems they didn't fully understand, and incidents often involved finger-pointing about whose fault problems were. This model doesn't work at modern software scales.

DevOps culture unifies development and operations. The engineers who write code also deploy it, monitor it, carry pagers for on-call rotations, and debug production issues at 3am. This ownership changes everything. When you're the one woken up by production alerts, you suddenly care deeply about error handling, logging, and monitoring. When you're debugging a production incident, you understand exactly how the system works because you built it. This unified ownership produces better systems because the people designing them feel the operational consequences directly.

The Software Development Lifecycle (SDLC)

Professional engineering teams don’t treat deployment or operations as isolated events. Every feature your team builds moves through a predictable sequence of stages known as the Software Development Lifecycle (SDLC). Understanding this lifecycle helps you see where production operations fit—and why they matter.

The SDLC describes the end-to-end journey of software:

  • Plan: Define what you’re building and why. Requirements, user needs, constraints.
  • Design: Architect the system, choose technologies, design data flows.
  • Implement: Write code, create tests, build features.
  • Test: Validate correctness through automated and manual testing.
  • Deploy: Release software into a production environment.
  • Operate: Monitor, debug, scale, secure, optimize, and maintain the system.
  • Improve: Learn from incidents, update the system, refine processes.
Diagram titled 'The Complete SDLC' showing seven stages in a linear flow with a feedback loop. Stages progress from Plan, Design, Implement, Test, Deploy (lighter colors) to Operate and Improve (darker colors). Two annotations indicate 'Most tutorials stop here' pointing to Deploy, and 'Professional engineering focuses here' pointing to Operate and Improve. A curved arrow labeled 'Feedback Loop' connects Improve back to Plan.
The complete Software Development Lifecycle shows that deployment is just the midpoint. Professional engineering focuses on the Operate and Improve stages, where reliability, cost optimization, and continuous improvement happen.

In tutorials, the SDLC often ends at “Deploy.” In real engineering work, that’s only the halfway point. The Operate and Improve stages dominate the actual life of your application—they determine reliability, stability, cost, and user experience. This chapter focuses on those final two stages, where professional operations practices turn a working deployment into a reliable system.

How SDLC Connects to DevOps

DevOps isn’t just tools—it’s a cultural shift that brings the Operate and Improve stages into everyday development work. The same engineers who write the code also deploy, monitor, and maintain it. The SDLC gives you the big-picture sequence; DevOps clarifies that your responsibility doesn’t end at Deploy. The rest of this chapter shows how CI/CD, monitoring, auto-scaling, and automation strengthen those Operate and Improve stages.

With this broader context, we can now zoom into the recurring loop that powers day-to-day operations: the Production Operations Lifecycle.

The Production Operations Lifecycle

Operations is a continuous cycle, not a linear process. Systems move through the same stages again and again as you deploy updates, respond to issues, and improve reliability.

Diagram titled 'The Production Operations Lifecycle' showing a circular flow with four stages around a central circle labeled 'OPERATIONS LIFECYCLE'. The four stages are: Deploy (Automation) at top in orange, Monitor (Observability) at right in teal, Respond (Incidents) at bottom in pink, and Improve (Optimization) at left in green. Blue arrows connect them clockwise with labels: Update, Observe, Detect, and Learn.
Operations is a continuous cycle: deploy code, monitor behavior, respond to issues, improve based on learnings, then deploy improvements. This feedback loop is how systems become reliable.

Deploy:

Get code changes running in production safely. This includes building artifacts (Docker images), updating infrastructure (ECS task definitions), and verifying the deployment succeeded (health checks passing, no error rate spikes). Deployment shouldn't be a stressful event—automation and rollback capabilities make it routine. Professional teams deploy multiple times per day because deployment is boring, predictable, and safe.

Monitor:

Observe system behavior continuously. Logs show what happened (request received, query executed, error occurred). Metrics quantify behavior (requests per second, response time percentiles, CPU utilization). Distributed traces connect requests across multiple services. Good monitoring lets you answer questions like "Why are 5% of requests failing?" or "Which database query is slow?" without SSH-ing into servers or adding print statements.

Respond:

Fix problems when they occur. Production incidents happen: servers fail, databases run out of connections, traffic spikes overwhelm capacity, bugs manifest under specific conditions. Good incident response means detecting problems quickly (monitoring and alarms), diagnosing root causes efficiently (comprehensive logging), fixing issues correctly (understanding the system architecture), and preventing recurrence (improving the system or its monitoring).

Improve:

Make systems more reliable over time. Post-incident reviews identify improvements: better error handling, clearer logging, faster auto-scaling, improved monitoring. Capacity planning prevents resource exhaustion. Performance optimization reduces costs while maintaining responsiveness. This continuous improvement distinguishes mature operations practices from reactive firefighting.

The cycle repeats continuously: deploy new code, monitor its behavior, respond to issues, improve based on learnings, then deploy the improvements. This feedback loop is how systems become more reliable and operators become more skilled. Every incident is a learning opportunity; every deployment teaches you something about your system under real load.

Key Operations Metrics

Professional operations teams track metrics quantifying reliability and operational effectiveness. These metrics guide decisions about infrastructure investments, team priorities, and system improvements.

Uptime (Availability):

The percentage of time your system is available and functioning correctly. 99% uptime sounds good but means 7.2 hours of downtime per month. 99.9% (three nines) means 43 minutes per month. 99.99% (four nines) means 4.3 minutes per month. Each additional nine requires exponentially more effort and cost. Most web applications target 99.9% or 99.95% because achieving 99.99% requires redundancy across geographic regions, which adds significant complexity and expense.

MTTR (Mean Time to Recovery):

How long it takes to restore service after incidents. Fast detection (good monitoring) and quick diagnosis (comprehensive logging) reduce MTTR. Automated rollback capabilities reduce MTTR more than anything else. If deployment causes problems, rolling back takes seconds instead of hours. Professional teams measure MTTR in minutes, not hours. Reducing MTTR from 2 hours to 10 minutes means incidents affect users for 10 minutes instead of 2 hours, which dramatically improves perceived reliability.

Change Failure Rate:

The percentage of deployments that cause incidents. If you deploy 100 times and 5 deployments cause production issues requiring rollback or hotfixes, your change failure rate is 5%. Lower is better, but zero is unrealistic, software systems are complex and bugs happen. Professional teams target 5-15% change failure rates by combining good testing practices, staged rollouts, and comprehensive monitoring that detects problems quickly.

Deployment Frequency:

How often you deploy to production. High-performing teams deploy multiple times per day. This seems risky, but the opposite is true: frequent small deployments are safer than infrequent large deployments. Small changes are easier to test, easier to reason about, and easier to roll back. Large deployments with weeks of accumulated changes create complex testing scenarios and ambiguous rollback decisions. Automation enables high deployment frequency—manual processes become bottlenecks.

Why Manual Processes Don't Scale

Manual deployment processes work until they don't. Running AWS CLI commands for the first deployment takes 15 minutes and feels manageable. By the tenth deployment, you've spent 2.5 hours on repetitive tasks. By the hundredth deployment, you've spent 25 hours and that assumes no mistakes requiring re-runs. Across a team of five engineers deploying independently, manual processes create coordination nightmares.

Automation pays for itself immediately. Building a CI/CD pipeline takes a few hours. After that, every deployment is free, consistent, and fast. Teams with good automation deploy 10-50x per day without thinking about it. Teams with manual processes deploy weekly and treat each deployment as a risky event requiring coordination and weekend work. This difference compounds over time. Automated teams iterate faster, learn faster, and build better systems because deployment friction doesn't slow them down.

Operations as Code

Traditional operations involved manual changes: SSH into servers, edit configuration files, restart services, document changes in wikis that become outdated. This approach doesn't scale. Manual changes aren't reproducible—two engineers configuring identical services will make different choices. Manual changes aren't versionable—you can't review them, roll them back, or understand what changed when problems occur.

Infrastructure as Code means defining infrastructure in version-controlled files. AWS resources (ECS clusters, RDS instances, load balancers) become code written in tools like Terraform or CloudFormation. Configuration files (task definitions, scaling policies) become YAML or JSON in Git repositories. Database schema migrations become versioned Alembic scripts. When infrastructure is code, you can review it, test it, version it, and roll it back like application code.

This chapter uses Infrastructure as Code principles throughout. GitHub Actions workflows are YAML files in your repository. ECS task definitions are JSON files. CloudWatch dashboards are defined in code. This approach makes operations reproducible (running the same code produces the same infrastructure), auditable (Git history shows every change), and reviewable (pull requests show proposed infrastructure changes before they happen).

In this book, you're not writing full Terraform modules, but you are treating task definitions, scaling policies, and CI/CD workflows as code, which builds the same muscle.

The benefits compound over time. New team members onboard by reading infrastructure code, not outdated wikis. Production problems are debugged by comparing current infrastructure to previous versions. Disaster recovery becomes running the infrastructure code in a new AWS region. Operations as Code transforms operations from manual artisanal work into systematic engineering practices.

3. CI/CD with GitHub Actions

In Section 1 you learned that CI/CD automates deployment, eliminating the 15 minutes of manual AWS CLI commands you currently run for each deployment. This section teaches you to build that automation using GitHub Actions. By the end, every git push to your main branch will automatically test your code, build Docker images, and deploy to ECS—without any manual steps.

Understanding CI/CD

CI/CD stands for Continuous Integration and Continuous Deployment. It's an automated pipeline that moves code from your laptop to production without manual intervention. Instead of manually running tests, building Docker images, and deploying with AWS CLI commands, CI/CD automates the entire workflow: code push → tests run → Docker image builds → image pushes to ECR → ECS updates to new version. The entire process completes in 5-8 minutes automatically.

Continuous Integration (CI)

Continuous Integration means developers merge small, frequent changes into the main branch, and each change is validated automatically. The CI part of the pipeline focuses on quality: running tests, checking formatting, enforcing code standards, and catching regressions early. CI shortens feedback loops—problems surface minutes after writing code, not weeks later during manual testing.

Continuous Deployment (CD)

Continuous Deployment means that once your code passes all checks, it deploys automatically to production. Modern engineering teams deploy dozens of times per day safely because the CD pipeline handles the tedious, risk-prone steps: building Docker images, pushing them to ECR, updating ECS task definitions, and rolling new versions out gradually. Automation turns deployment from a stressful event into a routine operation.

Why CI/CD Matters

CI/CD pipelines eliminate entire categories of problems: forgotten tests, incorrect Docker tags, inconsistent environments, and mistakes caused by manual commands. They also make your development process faster—small changes ship quickly, rollbacks are trivial, and deployments happen with confidence rather than fear. For your News API, CI/CD ensures that every update follows the exact same path: test → build → package → deploy → verify. No surprises.

The Goal: Safe, Boring Deployments

The best engineering teams deploy constantly, and their deployments are boring. No late-night outages, no emergency rollbacks, no "it works on my laptop" surprises. CI/CD pipelines make deployments boring by removing human error and enforcing a consistent process. When deployment becomes safe and predictable, teams iterate faster, deliver features sooner, and reduce the operational burden on everyone.

GitHub Actions Architecture

GitHub Actions is a CI/CD platform built into GitHub. When you push code to a repository, GitHub can automatically run workflows—sequences of jobs executing commands. Workflows are defined in YAML files stored in your repository at .github/workflows/. This approach means your CI/CD configuration is versioned alongside your code.

Workflows

The top-level concept. A workflow defines when to run (on push to main branch, on pull request, on schedule) and what to run (one or more jobs). Your News API will have a deployment workflow triggered by pushes to the main branch.

Jobs

Collections of steps that run on the same machine (called a runner). Jobs can run sequentially or in parallel. Your deployment workflow will have jobs for testing, building Docker images, and deploying to ECS. These jobs run sequentially because each depends on the previous job's success.

Steps

Individual commands or actions. A step might run shell commands (pytest to run tests), use pre-built actions (aws-actions/amazon-ecr-login to authenticate with ECR), or checkout code (actions/checkout). Steps in a job share the same filesystem and environment variables, enabling data passing between steps.

Runners

The machines executing workflows. GitHub provides hosted runners (Ubuntu, Windows, macOS) for free public repositories and limited free minutes for private repositories. Runners clone your repository, execute workflow steps, and report results. For AWS deployments, Ubuntu runners work perfectly—they have Docker, Python, and AWS CLI pre-installed.

Managing AWS Credentials Securely

Your GitHub Actions workflow needs AWS credentials to push images to ECR and update ECS services. Hardcoding access keys in workflow files would be a security disaster—anyone with repository access sees the keys, and they're committed to Git history forever. GitHub Secrets solves this problem by storing sensitive values encrypted and accessible only to workflows.

Create an IAM user for GitHub Actions:

Terminal - Create IAM User for CI/CD
# Create IAM user
aws iam create-user --user-name github-actions-deploy

# Create access key for programmatic access
aws iam create-access-key --user-name github-actions-deploy

# Save the AccessKeyId and SecretAccessKey from output
# You'll need these for GitHub Secrets

Create and attach permissions policy:

This policy grants the minimum permissions needed for deployment:

github-actions-policy.json
{
  "Version": "2012-10-17",
  "Statement": [
    {
      "Effect": "Allow",
      "Action": [
        "ecr:GetAuthorizationToken",
        "ecr:BatchCheckLayerAvailability",
        "ecr:GetDownloadUrlForLayer",
        "ecr:BatchGetImage",
        "ecr:PutImage",
        "ecr:InitiateLayerUpload",
        "ecr:UploadLayerPart",
        "ecr:CompleteLayerUpload"
      ],
      "Resource": "*"
    },
    {
      "Effect": "Allow",
      "Action": [
        "ecs:DescribeTaskDefinition",
        "ecs:RegisterTaskDefinition",
        "ecs:UpdateService",
        "ecs:DescribeServices"
      ],
      "Resource": "*"
    },
    {
      "Effect": "Allow",
      "Action": [
        "iam:PassRole"
      ],
      "Resource": "arn:aws:iam::*:role/ecsTaskExecutionRole"
    }
  ]
}

Attach the policy to your IAM user:

Terminal - Attach Policy to User
# Create the policy from the JSON file
aws iam create-policy \
    --policy-name GitHubActionsDeployPolicy \
    --policy-document file://github-actions-policy.json

# Get your AWS account ID
ACCOUNT_ID=$(aws sts get-caller-identity --query Account --output text)

# Attach the policy to the user
aws iam attach-user-policy \
    --user-name github-actions-deploy \
    --policy-arn arn:aws:iam::${ACCOUNT_ID}:policy/GitHubActionsDeployPolicy

# Verify the policy is attached
aws iam list-attached-user-policies \
    --user-name github-actions-deploy

Creating Your Complete CI/CD Workflow

Now you'll create the complete GitHub Actions workflow that automates your entire deployment pipeline. This workflow runs tests, builds Docker images, pushes to ECR, and deploys to ECS automatically on every push to the main branch.

Add AWS credentials to GitHub Secrets:

Before creating the workflow, store your AWS credentials securely in GitHub:

  1. Navigate to your repository on GitHub
  2. Click SettingsSecrets and variablesActions
  3. Click New repository secret
  4. Add AWS_ACCESS_KEY_ID with the value from your IAM user creation
  5. Add AWS_SECRET_ACCESS_KEY with the secret access key value
  6. Add AWS_ACCOUNT_ID with your 12-digit AWS account ID

Create the workflow file:

In your repository, create .github/workflows/deploy.yml:

.github/workflows/deploy.yml - Complete CI/CD Pipeline
name: Deploy to AWS ECS

on:
  push:
    branches: [ main ]
  pull_request:
    branches: [ main ]

env:
  AWS_REGION: us-east-1
  ECR_REPOSITORY: news-api
  ECS_SERVICE: news-api-service
  ECS_CLUSTER: news-api-cluster
  ECS_TASK_DEFINITION: news-api-task
  CONTAINER_NAME: news-api

jobs:
  test:
    name: Run Tests
    runs-on: ubuntu-latest
    
    steps:
      - name: Checkout code
        uses: actions/checkout@v3
      
      - name: Set up Python 3.11
        uses: actions/setup-python@v4
        with:
          python-version: '3.11'
      
      - name: Cache pip dependencies
        uses: actions/cache@v3
        with:
          path: ~/.cache/pip
          key: ${{ runner.os }}-pip-${{ hashFiles('**/requirements.txt') }}
          restore-keys: |
            ${{ runner.os }}-pip-
      
      - name: Install dependencies
        run: |
          python -m pip install --upgrade pip
          pip install -r requirements.txt
          pip install pytest pytest-cov
      
      - name: Run tests with coverage
        run: |
          pytest --cov=app --cov-report=term-missing
      
      - name: Check test coverage threshold
        run: |
          coverage report --fail-under=70

  build-and-deploy:
    name: Build and Deploy
    needs: test
    runs-on: ubuntu-latest
    # Only run on pushes to main (not on pull requests)
    if: github.event_name == 'push' && github.ref == 'refs/heads/main'
    
    steps:
      - name: Checkout code
        uses: actions/checkout@v3
      
      - name: Configure AWS credentials
        uses: aws-actions/configure-aws-credentials@v2
        with:
          aws-access-key-id: ${{ secrets.AWS_ACCESS_KEY_ID }}
          aws-secret-access-key: ${{ secrets.AWS_SECRET_ACCESS_KEY }}
          aws-region: ${{ env.AWS_REGION }}
      
      - name: Login to Amazon ECR
        id: login-ecr
        uses: aws-actions/amazon-ecr-login@v1
      
      - name: Build, tag, and push image to Amazon ECR
        id: build-image
        env:
          ECR_REGISTRY: ${{ steps.login-ecr.outputs.registry }}
          IMAGE_TAG: ${{ github.sha }}
        run: |
          # Build Docker image
          docker build -t $ECR_REGISTRY/$ECR_REPOSITORY:$IMAGE_TAG .
          docker build -t $ECR_REGISTRY/$ECR_REPOSITORY:latest .
          
          # Push both tags to ECR
          docker push $ECR_REGISTRY/$ECR_REPOSITORY:$IMAGE_TAG
          docker push $ECR_REGISTRY/$ECR_REPOSITORY:latest
          
          # Output image URI for next step
          echo "image=$ECR_REGISTRY/$ECR_REPOSITORY:$IMAGE_TAG" >> $GITHUB_OUTPUT
      
      - name: Download current task definition
        run: |
          aws ecs describe-task-definition \
            --task-definition ${{ env.ECS_TASK_DEFINITION }} \
            --query taskDefinition > task-definition.json
      
      - name: Update task definition with new image
        id: task-def
        uses: aws-actions/amazon-ecs-render-task-definition@v1
        with:
          task-definition: task-definition.json
          container-name: ${{ env.CONTAINER_NAME }}
          image: ${{ steps.build-image.outputs.image }}
      
      - name: Deploy to Amazon ECS
        uses: aws-actions/amazon-ecs-deploy-task-definition@v1
        with:
          task-definition: ${{ steps.task-def.outputs.task-definition }}
          service: ${{ env.ECS_SERVICE }}
          cluster: ${{ env.ECS_CLUSTER }}
          wait-for-service-stability: true
      
      - name: Verify deployment
        run: |
          echo "Deployment completed successfully!"
          echo "Image deployed: ${{ steps.build-image.outputs.image }}"
          
          # Get service status
          aws ecs describe-services \
            --cluster ${{ env.ECS_CLUSTER }} \
            --services ${{ env.ECS_SERVICE }} \
            --query 'services[0].{Status:status,Running:runningCount,Desired:desiredCount}' \
            --output table
      
      - name: Post deployment notification
        if: success()
        run: |
          echo "✅ Deployment successful!"
          echo "Commit: ${{ github.sha }}"
          echo "Deployed by: ${{ github.actor }}"
      
      - name: Deployment failure notification
        if: failure()
        run: |
          echo "❌ Deployment failed!"
          echo "Check the logs above for details"

Understanding the workflow structure:

Quality gates: The build-and-deploy job depends on test passing (needs: test). If tests fail, deployment never runs. This prevents broken code from reaching production.

Pull request protection: The deployment job only runs on pushes to main, not on pull requests. Pull requests run tests but don't deploy, enabling safe code review before merging.

Image tagging strategy: Each build creates two tags: the Git commit SHA (immutable, traceable) and latest (convenient for local development). Production uses SHA tags for exact version tracking.

Deployment verification: The wait-for-service-stability flag makes the workflow wait until ECS confirms the deployment succeeded (all tasks healthy). If deployment fails, the workflow reports failure.

Caching Dependencies for Faster Builds

The workflow uses GitHub Actions cache for pip dependencies. First run takes 2-3 minutes installing dependencies. Subsequent runs restore from cache, completing in 30-45 seconds. This caching dramatically speeds up your CI/CD pipeline—hundreds of builds per month save hours of compute time.

Testing Your CI/CD Pipeline

Now verify your CI/CD pipeline works end-to-end by triggering a deployment.

Trigger your first automated deployment:

Terminal - Trigger Deployment
# Make a small code change to trigger deployment
echo "# Deployment test" >> README.md

# Commit and push to main branch
git add README.md
git commit -m "Test CI/CD pipeline"
git push origin main

Watch the workflow execute:

  1. Navigate to your GitHub repository
  2. Click the Actions tab
  3. Click the most recent workflow run (your commit message)
  4. Watch the test job complete (1-2 minutes)
  5. Watch the build-and-deploy job execute (3-5 minutes)
  6. Verify all steps show green checkmarks

Verify deployment in AWS:

Terminal - Verify Deployment
# Check ECS service is running new tasks
aws ecs describe-services \
    --cluster news-api-cluster \
    --services news-api-service \
    --query 'services[0].{Running:runningCount,Desired:desiredCount,TaskDef:taskDefinition}' \
    --output table

# Check task definition image matches Git SHA
aws ecs describe-task-definition \
    --task-definition news-api-task \
    --query 'taskDefinition.containerDefinitions[0].image'

# Result should show: ACCOUNT_ID.dkr.ecr.us-east-1.amazonaws.com/news-api:abc123
# where abc123 is your Git commit SHA

Test your live API:

Terminal - Test Deployed API
# Get your ALB DNS name
aws elbv2 describe-load-balancers \
    --names news-api-alb \
    --query 'LoadBalancers[0].DNSName' \
    --output text

# Test the API
curl http://YOUR-ALB-DNS/docs
# Should return your FastAPI documentation page

# Test an endpoint
curl http://YOUR-ALB-DNS/api/articles
# Should return articles from your database
✅ CI/CD Pipeline Verified!

If all steps succeeded, you now have a fully automated deployment pipeline. Every future git push to main triggers tests automatically, builds Docker images, and deploys to production. You've eliminated 15 minutes of manual work per deployment and prevented entire categories of human error.

Common CI/CD Issues and Solutions

Workflow runs but deployment job skips: Check that you pushed to main branch, not a feature branch. The workflow only deploys from main.

AWS authentication fails: Verify GitHub Secrets are set correctly. Secret names are case-sensitive and must match exactly: AWS_ACCESS_KEY_ID, AWS_SECRET_ACCESS_KEY.

Tests pass locally but fail in CI: GitHub Actions runs in a fresh environment. You might have dependencies installed locally that aren't in requirements.txt. Add missing dependencies and push again.

Deployment succeeds but tasks fail health checks: Check CloudWatch Logs for container startup errors. Common causes: missing environment variables, database connection failures, port misconfiguration.

4. CloudWatch Monitoring and Observability

Observability means understanding what your system is doing by examining its outputs. You can't SSH into production containers to add print statements or run debuggers. Instead, you observe system behavior through three types of telemetry: logs (what happened), metrics (quantified behavior over time), and traces (request paths through distributed systems). Good observability lets you answer questions about production without modifying code or redeploying.

CloudWatch is AWS's observability platform. It collects logs from all ECS containers in one place, tracks metrics like CPU utilization and request counts, and provides query tools for analyzing both. Chapter 28 configured CloudWatch logging for your containers—every line your application prints goes to CloudWatch Logs. Now you'll leverage that data with dashboards, alarms, and query capabilities.

The Golden Signals Framework

Systems generate thousands of potential metrics. CPU usage, memory usage, disk I/O, network throughput, request counts, error rates, database connections, cache hit rates, and so on. Monitoring everything creates noise—you can't distinguish signal from noise when dashboards show 50 metrics. The Golden Signals framework identifies the four metrics that matter most for user-facing systems.

1.

Latency

How long requests take. Latency directly affects user experience—200ms feels instant, 2 seconds feels slow, 20 seconds causes users to abandon requests. Track latency at percentiles, not averages. Average latency hides problems: if 95% of requests take 100ms but 5% take 10 seconds, average latency is still reasonable even though many users experience terrible performance. Monitor p50 (median), p90, p95, and p99 latency. If p99 latency spikes, 1 in 100 users experiences slow requests—this matters even if most users are unaffected.

2.

Traffic

How many requests your system handles. Traffic measured in requests per second (RPS) or queries per second (QPS). Rising traffic might indicate growing usage (good) or automated attacks (bad). Falling traffic might indicate service degradation causing users to give up. Traffic patterns reveal system behavior: steady baseline with daily peaks, sudden spikes during marketing campaigns, gradual growth over weeks. Understanding traffic patterns helps capacity planning and incident detection.

3.

Errors

What percentage of requests fail. Errors measured as error rate (percentage) or error count (absolute number). A 5% error rate means 1 in 20 requests fails—this is terrible user experience. Track errors by type: 4xx errors (client errors like 404 Not Found or 401 Unauthorized) indicate client problems, 5xx errors (server errors like 500 Internal Server Error or 503 Service Unavailable) indicate your system failing. Rising 5xx error rates are production incidents requiring immediate investigation.

4.

Saturation

How close to capacity limits your system is. Saturation measures resource utilization: CPU at 70% is comfortable, CPU at 95% means you're nearing capacity limits. Memory, database connections, disk space, network bandwidth—all have saturation points where performance degrades. Monitor saturation to detect capacity issues before they cause outages. If database connection pool hits 100% utilization, new requests fail even though CPU and memory are fine.

Why Four Signals, Not Fifty Metrics?

The Golden Signals framework emerged from Google's experience operating massive-scale systems. More metrics don't mean better observability—they mean more noise. Four signals capture the essential aspects of user-facing system health. If latency, traffic, errors, and saturation all look normal, your system is probably healthy. If any signal shows anomalies, you investigate deeper. This approach scales: a team operating 100 services can monitor 400 metrics (4 per service) instead of 5000. Focused monitoring enables faster incident detection and response.

Creating a CloudWatch Dashboard

CloudWatch Dashboards provide visual representation of your metrics. You'll create a dashboard tracking the Golden Signals for your News API, giving you real-time visibility into production health.

Create the dashboard:

Terminal - Create CloudWatch Dashboard
aws cloudwatch put-dashboard \
    --dashboard-name NewsAPIProductionHealth \
    --dashboard-body file://dashboard-config.json

Dashboard configuration: Create dashboard-config.json defining your Golden Signals widgets. Replace YOUR-ALB-ARN-SUFFIX with your actual ALB identifier:

dashboard-config.json - Complete Configuration
{
  "widgets": [
    {
      "type": "metric",
      "x": 0,
      "y": 0,
      "width": 12,
      "height": 6,
      "properties": {
        "metrics": [
          ["AWS/ApplicationELB", "TargetResponseTime", 
           {"stat": "Average", "label": "Average Latency", "yAxis": "left"}],
          ["...", {"stat": "p90", "label": "P90 Latency", "yAxis": "left"}],
          ["...", {"stat": "p99", "label": "P99 Latency", "yAxis": "left"}]
        ],
        "view": "timeSeries",
        "stacked": false,
        "region": "us-east-1",
        "title": "Latency (Response Time)",
        "period": 60,
        "yAxis": {
          "left": {
            "min": 0,
            "label": "Seconds"
          }
        }
      }
    },
    {
      "type": "metric",
      "x": 12,
      "y": 0,
      "width": 12,
      "height": 6,
      "properties": {
        "metrics": [
          ["AWS/ApplicationELB", "RequestCount", 
           {"stat": "Sum", "label": "Total Requests"}]
        ],
        "view": "timeSeries",
        "stacked": false,
        "region": "us-east-1",
        "title": "Traffic (Requests Per Minute)",
        "period": 60,
        "yAxis": {
          "left": {
            "min": 0,
            "label": "Requests"
          }
        }
      }
    },
    {
      "type": "metric",
      "x": 0,
      "y": 6,
      "width": 12,
      "height": 6,
      "properties": {
        "metrics": [
          ["AWS/ApplicationELB", "HTTPCode_Target_5XX_Count", 
           {"stat": "Sum", "label": "5XX Errors", "color": "#d62728"}],
          [".", "HTTPCode_Target_4XX_Count", 
           {"stat": "Sum", "label": "4XX Errors", "color": "#ff7f0e"}]
        ],
        "view": "timeSeries",
        "stacked": false,
        "region": "us-east-1",
        "title": "Errors (By Status Code)",
        "period": 60,
        "yAxis": {
          "left": {
            "min": 0,
            "label": "Error Count"
          }
        }
      }
    },
    {
      "type": "metric",
      "x": 12,
      "y": 6,
      "width": 12,
      "height": 6,
      "properties": {
        "metrics": [
          ["AWS/ECS", "CPUUtilization", 
           {"stat": "Average", "label": "CPU Usage", 
            "dimensions": {"ServiceName": "news-api-service", "ClusterName": "news-api-cluster"}}],
          [".", "MemoryUtilization", 
           {"stat": "Average", "label": "Memory Usage",
            "dimensions": {"ServiceName": "news-api-service", "ClusterName": "news-api-cluster"}}]
        ],
        "view": "timeSeries",
        "stacked": false,
        "region": "us-east-1",
        "title": "Saturation (Resource Utilization)",
        "period": 60,
        "yAxis": {
          "left": {
            "min": 0,
            "max": 100,
            "label": "Percentage"
          }
        }
      }
    }
  ]
}

Find your ALB ARN suffix:

Terminal - Get ALB Identifier
# Get your ALB ARN
aws elbv2 describe-load-balancers \
    --names news-api-alb \
    --query 'LoadBalancers[0].LoadBalancerArn' \
    --output text

# Output looks like: arn:aws:elasticloadbalancing:us-east-1:123456789:loadbalancer/app/news-api-alb/abc123def456
# The suffix you need is: app/news-api-alb/abc123def456

Note that the ALB metrics in this configuration apply to all traffic through the load balancer. If you want metrics specific to your target group, you can add TargetGroup dimensions, but for most monitoring purposes, load balancer-level metrics provide the visibility you need.

Verifying Your Dashboard Works

After creating your dashboard, verify it's collecting metrics correctly:

  1. Open CloudWatch → Dashboards → NewsAPIProductionHealth
  2. Set time range to "Last 1 hour"
  3. Generate some traffic to your API with curl or browser
  4. Refresh dashboard after 1-2 minutes

What healthy metrics look like:

  • Latency: Average 50-200ms, P90 100-400ms, P99 200-800ms. Flat lines indicate consistent performance. Spikes indicate slow queries or external API delays.
  • Traffic: Varies by usage. Even small numbers (5-10 requests/minute) during testing confirm the dashboard works. Production might show 100-1000+ requests/minute.
  • Errors: Should be zero or near-zero most of the time. Occasional 4xx errors (user mistakes like bad parameters) are normal. 5xx errors indicate your application failing.
  • Saturation: CPU 20-40% is healthy with headroom. Memory 40-60% is typical. Both consistently at 80%+ indicates you need more capacity or have a performance problem.
Reading Dashboard Patterns

Flat lines with no data: Dashboard is configured correctly but no traffic is flowing. Generate requests to your API.

Saw-tooth pattern in CPU: Normal if you have auto-scaling enabled. CPU rises, scaling adds tasks, CPU drops as load distributes.

Latency spikes correlating with traffic spikes: Your system struggles under load. Consider adding caching, optimizing slow queries, or enabling auto-scaling.

Sudden error rate jump from 0% to 10%+: Production incident. Use CloudWatch Logs Insights to investigate what changed—recent deployment, database issue, external API problem.

Creating Meaningful Alarms

Dashboards require someone watching them. Alarms notify you when metrics cross thresholds, enabling proactive response instead of reactive firefighting. Good alarms trigger before users notice problems. Bad alarms create alert fatigue—too many false positives train operators to ignore them.

Create an alarm for high error rates:

Terminal - Create Error Rate Alarm
aws cloudwatch put-metric-alarm \
    --alarm-name news-api-high-5xx-errors \
    --alarm-description "Alert when 5XX error count exceeds 10 in 5 minutes" \
    --metric-name HTTPCode_Target_5XX_Count \
    --namespace AWS/ApplicationELB \
    --statistic Sum \
    --period 300 \
    --threshold 10 \
    --comparison-operator GreaterThanThreshold \
    --evaluation-periods 1 \
    --treat-missing-data notBreaching

This alarm triggers if your API returns more than 10 5xx errors in a 5-minute window. The evaluation-periods 1 means the threshold must be crossed in one period (5 minutes) to trigger. The treat-missing-data notBreaching means no errors (missing data) doesn't trigger alarms.

Create an alarm for high latency:

Terminal - Create Latency Alarm
aws cloudwatch put-metric-alarm \
    --alarm-name news-api-high-p99-latency \
    --alarm-description "Alert when P99 latency exceeds 1000ms" \
    --metric-name TargetResponseTime \
    --namespace AWS/ApplicationELB \
    --statistic p99 \
    --period 300 \
    --threshold 1.0 \
    --comparison-operator GreaterThanThreshold \
    --evaluation-periods 2

This alarm triggers if p99 latency exceeds 1 second for two consecutive 5-minute periods (10 minutes total). The double evaluation period prevents transient spikes from triggering alarms—only sustained latency problems trigger.

Create an alarm for high CPU saturation:

Terminal - Create CPU Saturation Alarm
aws cloudwatch put-metric-alarm \
    --alarm-name news-api-high-cpu \
    --alarm-description "Alert when CPU exceeds 85% for 10 minutes" \
    --metric-name CPUUtilization \
    --namespace AWS/ECS \
    --dimensions Name=ServiceName,Value=news-api-service \
                 Name=ClusterName,Value=news-api-cluster \
    --statistic Average \
    --period 300 \
    --threshold 85 \
    --comparison-operator GreaterThanThreshold \
    --evaluation-periods 2

This alarm triggers if average CPU utilization exceeds 85% for two consecutive 5-minute periods. High CPU indicates you're nearing capacity—either traffic increased beyond expectations or application performance degraded. This alarm gives you early warning to investigate before CPU hits 100% and requests start timing out.

Preventing Alert Fatigue

Alert fatigue happens when alarms trigger so frequently that operators ignore them. Common causes: thresholds set too low (alerting on normal variations), single evaluation periods (transient spikes trigger alarms), and alarms without actionable response procedures. Good alarm design requires thoughtful thresholds based on baseline behavior, multiple evaluation periods filtering transient issues, and documented runbooks explaining what to do when alarms trigger. If you can't write a runbook for an alarm, delete the alarm—it's creating noise, not signal.

Querying Logs with CloudWatch Logs Insights

Your containers write logs to CloudWatch Logs. Reading logs line-by-line works for simple debugging, but production systems generate thousands of log lines per minute across multiple containers. CloudWatch Logs Insights provides a query language for analyzing logs at scale.

Find all 500 errors in the last hour:

CloudWatch Logs Insights Query
fields @timestamp, @message
| filter @message like /500/
| filter @message like /ERROR/
| sort @timestamp desc
| limit 50

This query finds log lines containing "500" and "ERROR", sorts by timestamp descending (newest first), and limits results to 50 lines. Run this in CloudWatch → Logs → Insights, select your log group (/ecs/news-api), and execute.

Count requests by endpoint:

CloudWatch Logs Insights Query
fields @timestamp, @message
| filter @message like /GET/
| parse @message /GET (?\/[^ ]*)/
| stats count() by endpoint
| sort count desc

This query extracts endpoints from GET request logs using regex parsing, counts requests per endpoint, and sorts by count. This helps identify your busiest endpoints for optimization efforts.

Find slow database queries:

CloudWatch Logs Insights Query
fields @timestamp, @message
| filter @message like /database query took/
| parse @message /query took (?\d+)ms/
| filter duration > 1000
| sort duration desc
| limit 20

This query finds database queries taking longer than 1 second, assuming your application logs query duration. Identifying slow queries guides database optimization efforts—adding indexes, rewriting queries, or caching results.

CloudWatch Logs Insights queries are essential for production debugging. When alarms trigger or users report issues, you query logs to understand what happened without SSH-ing into containers or adding instrumentation. The query language takes practice, but the debugging power it provides is worth the learning investment.

5. Auto-Scaling Configuration

Auto-scaling means adjusting infrastructure capacity automatically based on demand. Your News API currently runs 2 ECS tasks at all times—during low-traffic periods at 3am when 2 tasks sit mostly idle, and during traffic spikes when 2 tasks struggle to keep up with load. Fixed capacity wastes money (paying for unused resources) and fails users (insufficient capacity during peaks). Auto-scaling solves both problems by growing capacity when needed and shrinking it when not.

Cloud economics make auto-scaling compelling. You pay for compute resources by the hour. Running 2 tasks continuously costs ~$50/month. Running 2 tasks during normal traffic and 10 tasks during peaks costs more during peaks but much less overall—you only pay for the extra 8 tasks while they're running. Auto-scaling can reduce costs by 50-70% while improving reliability by preventing capacity-related outages.

In ECS, auto-scaling uses target-tracking policies, which behave like a thermostat for your cluster. You pick a target value for a metric (for example 60% CPU utilization), and Application Auto Scaling automatically adds or removes tasks to keep the metric hovering around that target—scaling out when it gets too hot and scaling in when it cools down.

Understanding ECS Service Auto Scaling

ECS Service Auto Scaling adjusts your ECS service's desired task count based on CloudWatch metrics. When CPU utilization rises above your target, ECS launches more tasks. When CPU falls below target, ECS terminates tasks. This happens automatically without manual intervention.

Target-tracking scaling

The simplest and most effective auto-scaling strategy. You specify a target metric value (like "maintain 70% CPU utilization") and AWS figures out how many tasks achieve that target. If CPU rises to 85%, AWS launches more tasks to bring average CPU back to 70%. If CPU falls to 40%, AWS terminates tasks until average CPU rises to 70%. This policy requires no complex math—you declare your desired state and AWS maintains it.

Scale-out vs scale-in

Scale-out (adding capacity) happens quickly—AWS prioritizes availability, launching new tasks within 60-90 seconds of detecting high load. Scale-in (removing capacity) happens slowly—AWS is conservative about removing capacity, waiting 5-15 minutes to confirm load decreased before terminating tasks. This asymmetry prevents oscillation: rapidly adding capacity during traffic spikes, slowly removing capacity when traffic drops, never thrashing between states.

Cooldown periods

Prevent scaling decisions from interfering with each other. After scale-out, AWS waits for new tasks to start and stabilize before making additional scaling decisions. After scale-in, AWS waits to confirm load remains low before terminating more tasks. These cooldowns prevent cascading scaling events that overshoot targets.

Configuring Target-Tracking Auto-Scaling

You'll configure auto-scaling to maintain 70% average CPU utilization across all tasks. This gives you headroom for normal traffic variability while triggering scaling before performance degrades.

Register your ECS service as a scalable target:

Terminal - Register Scalable Target
aws application-autoscaling register-scalable-target \
    --service-namespace ecs \
    --resource-id service/news-api-cluster/news-api-service \
    --scalable-dimension ecs:service:DesiredCount \
    --min-capacity 2 \
    --max-capacity 10 \
    --region us-east-1

This registers your ECS service with Application Auto Scaling, setting minimum capacity (2 tasks always running) and maximum capacity (never exceed 10 tasks). These limits prevent scaling from going too low (always maintain minimum availability) or too high (control maximum cost).

Create the target-tracking policy:

Terminal - Create Scaling Policy
aws application-autoscaling put-scaling-policy \
    --service-namespace ecs \
    --resource-id service/news-api-cluster/news-api-service \
    --scalable-dimension ecs:service:DesiredCount \
    --policy-name news-api-cpu-scaling \
    --policy-type TargetTrackingScaling \
    --target-tracking-scaling-policy-configuration file://scaling-policy.json \
    --region us-east-1

Scaling policy configuration:

scaling-policy.json
{
  "TargetValue": 70.0,
  "PredefinedMetricSpecification": {
    "PredefinedMetricType": "ECSServiceAverageCPUUtilization"
  },
  "ScaleOutCooldown": 60,
  "ScaleInCooldown": 300
}

What this configuration means:

TargetValue: 70.0: Maintain 70% average CPU utilization across all tasks. When CPU exceeds 70%, scale out. When CPU falls below 70%, scale in.

ScaleOutCooldown: 60: After scaling out, wait 60 seconds before making another scaling decision. This gives new tasks time to start and begin handling traffic. Without cooldown, scaling decisions might overshoot by launching too many tasks.

ScaleInCooldown: 300: After scaling in, wait 5 minutes before making another scaling decision. This longer cooldown prevents premature scale-in during temporary load drops. If traffic spikes again quickly, you don't want to have just terminated tasks.

Verify scaling configuration:

Terminal - Describe Scaling Policies
aws application-autoscaling describe-scaling-policies \
    --service-namespace ecs \
    --resource-id service/news-api-cluster/news-api-service \
    --region us-east-1

# Output shows your scaling policy configuration

Load Testing to Trigger Auto-Scaling

The best way to validate auto-scaling works is to trigger it with real load. You'll use Apache Bench (ab) to generate HTTP requests, watch CPU utilization rise, and observe ECS launching additional tasks automatically.

Generate sustained load:

Terminal - Load Test with Apache Bench
# Install Apache Bench if needed
sudo apt-get install apache2-utils  # Ubuntu/Debian
brew install apache-bench           # macOS

# Generate load: 10000 requests, 50 concurrent connections
ab -n 10000 -c 50 http://your-alb-url.amazonaws.com/api/articles

# This generates sustained traffic for several minutes

Watch scaling in real-time:

In another terminal window, monitor your ECS service:

Terminal - Monitor Task Count
# Watch task count change every 10 seconds
watch -n 10 'aws ecs describe-services \
    --cluster news-api-cluster \
    --services news-api-service \
    --query "services[0].{Running:runningCount,Desired:desiredCount}" \
    --output table'

# Initially shows:
# Running: 2  Desired: 2

# After ~90 seconds of high load:
# Running: 4  Desired: 4

# After sustained load:
# Running: 6  Desired: 6

Observe CPU metrics in CloudWatch:

Open your CloudWatch dashboard. You'll see CPU utilization spike to 85-95% when load testing begins. After 60-90 seconds, desired task count increases and new tasks start. As new tasks come online and handle traffic, average CPU across all tasks falls back toward 70%. If you maintain load long enough, you'll eventually hit your maximum of 10 tasks.

Stop load testing and watch scale-in:

Stop the Apache Bench process. CPU utilization drops immediately. After 5 minutes (scale-in cooldown), ECS begins terminating excess tasks. Over 10-15 minutes, task count gradually returns to the minimum of 2 tasks.

This behavior is exactly what you want: rapid scale-out when load increases (protecting user experience), gradual scale-in when load decreases (preventing oscillation and preserving capacity for traffic resumption). Auto-scaling makes your infrastructure elastic—growing with demand, shrinking without it, optimizing both reliability and cost.

Right-Sizing Container Resources

Auto-scaling works best when containers are right-sized. If you allocate 2 vCPU and 4GB memory but your application only uses 0.5 vCPU and 1GB, you're paying for unused resources. If you allocate 0.25 vCPU and 512MB but your application needs 0.5 vCPU, containers struggle under load and CPU hits 100%. Monitor actual utilization over several days: if CPU averages 30%, reduce allocation. If CPU frequently hits 80%+, increase allocation. Right-sizing reduces costs (paying only for what you need) and improves scaling behavior (scaling triggers at appropriate load levels).

🛠️ Hands-On Exercise: Observe Auto-Scaling Behavior

Now that auto-scaling is configured, test it systematically to understand its behavior and verify it works correctly.

Exercise Goal

Watch your infrastructure scale from 2 tasks to 6-8 tasks under load, then scale back down to 2 tasks after load stops. You'll observe scaling latency (how long scale-out takes), cooldown behavior (why scale-in is slower), and cost implications (additional tasks only run when needed).

Step 1: Establish baseline

Terminal - Check Current State
# Record starting state
echo "=== Baseline State ==="
echo "Time: $(date)"

aws ecs describe-services \
    --cluster news-api-cluster \
    --services news-api-service \
    --query 'services[0].{Running:runningCount,Desired:desiredCount}' \
    --output table

aws cloudwatch get-metric-statistics \
    --namespace AWS/ECS \
    --metric-name CPUUtilization \
    --dimensions Name=ServiceName,Value=news-api-service Name=ClusterName,Value=news-api-cluster \
    --start-time $(date -u -d '5 minutes ago' +%Y-%m-%dT%H:%M:%S) \
    --end-time $(date -u +%Y-%m-%dT%H:%M:%S) \
    --period 300 \
    --statistics Average \
    --query 'Datapoints[0].Average'

# Expected: 2 running tasks, CPU around 20-40%

Step 2: Start sustained load

Terminal - Generate Load (Window 1)
# Get your ALB URL
ALB_URL=$(aws elbv2 describe-load-balancers \
    --names news-api-alb \
    --query 'LoadBalancers[0].DNSName' \
    --output text)

echo "Starting load test against: $ALB_URL"
echo "This will run for ~5 minutes generating sustained traffic"

# Generate load: 10000 requests, 50 concurrent
ab -n 10000 -c 50 http://$ALB_URL/api/articles

# Keep this window open and running

Step 3: Monitor scaling in real-time

Open a second terminal window and run this monitoring script:

Terminal - Monitor Scaling (Window 2)
# Watch task count change every 10 seconds
watch -n 10 'echo "=== $(date) ===" && \
aws ecs describe-services \
    --cluster news-api-cluster \
    --services news-api-service \
    --query "services[0].{Running:runningCount,Desired:desiredCount,Deployments:deployments[0].status}" \
    --output table'

# You should see:
# T+0:00 - Running: 2, Desired: 2
# T+1:30 - Running: 2, Desired: 4  (scaling decision made!)
# T+2:00 - Running: 3, Desired: 4  (new tasks starting)
# T+2:30 - Running: 4, Desired: 4  (scale-out complete)
# ... may continue scaling to 6-8 tasks depending on load

Step 4: Observe dashboard metrics

While load test runs, open your CloudWatch dashboard:

  • Watch CPU utilization spike from 30% to 85-95%
  • After 60-90 seconds, CPU should start dropping as new tasks come online
  • Traffic widget shows sustained request volume
  • Latency might spike slightly during scale-out (normal)

Step 5: Stop load and observe scale-in

After load test completes (or press Ctrl+C to stop it early):

Terminal - Monitor Scale-In
# Continue watching task count
# Scale-in is MUCH slower than scale-out

# Expected timeline:
# T+0:00 - Load stops, CPU drops to 10-20%
# T+5:00 - Still at 6-8 tasks (scale-in cooldown preventing action)
# T+8:00 - Desired count drops to 4 (first scale-in decision)
# T+13:00 - Desired count drops to 3
# T+18:00 - Back to minimum 2 tasks

# This gradual scale-in prevents thrashing if load resumes

Step 6: Record observations

Document what you observed:

  • Scale-out time: How long from load start to first new task? (Should be 60-120 seconds)
  • Maximum tasks: How many tasks ran at peak? (Likely 4-8 depending on load intensity)
  • Scale-in time: How long from load stop to return to minimum? (Should be 15-20 minutes)
  • Cost impact: 6 extra tasks for 5 minutes = 0.5 hours of extra compute = ~$0.15
✅ Exercise Complete: Auto-Scaling Verified

You've now observed elastic infrastructure in action. Your system automatically added capacity when needed, distributed load across multiple containers, then reduced capacity after load subsided. This elasticity is what makes cloud infrastructure economically efficient—you only pay for capacity when you need it.

Reflection Questions:

Q1: Why does scale-out happen in 60-90 seconds but scale-in takes 15-20 minutes?

A1: Asymmetric cooldown periods. AWS prioritizes availability over cost—adding capacity quickly prevents outages, removing capacity slowly prevents thrashing if load resumes. The 60-second scale-out cooldown gives new tasks time to start. The 300-second scale-in cooldown ensures load has truly subsided before removing capacity.

Q2: What would happen if you set minimum capacity to 1 task instead of 2?

A2: During deployments, your API would have zero healthy tasks briefly (single task stops, replacement starts, health checks pass). Zero tasks means downtime. Minimum of 2 ensures at least one healthy task during deployments.

Q3: How would you prevent auto-scaling from adding too many tasks during a load test?

A3: Set max-capacity to a reasonable limit (like 10 tasks) to control maximum cost. Auto-scaling respects this limit—it won't scale beyond max even if CPU stays high.

Advanced Scaling Strategies

CPU-based scaling works well for compute-bound applications, but other metrics might be more appropriate for your workload patterns.

Memory-based scaling:

Applications handling large request payloads or caching data in memory might exhaust memory before CPU. Target-tracking policies can use memory utilization instead of CPU:

Memory-based scaling policy
{
  "TargetValue": 75.0,
  "PredefinedMetricSpecification": {
    "PredefinedMetricType": "ECSServiceAverageMemoryUtilization"
  },
  "ScaleOutCooldown": 60,
  "ScaleInCooldown": 300
}

Request-count-based scaling:

For applications where load correlates directly with request count (simple CRUD APIs), scale based on requests per task:

Request-based scaling policy
{
  "TargetValue": 1000.0,
  "PredefinedMetricSpecification": {
    "PredefinedMetricType": "ALBRequestCountPerTarget"
  },
  "ScaleOutCooldown": 60,
  "ScaleInCooldown": 300
}

This policy maintains approximately 1000 requests per minute per task. When traffic increases beyond that threshold, scaling launches additional tasks to distribute load.

Custom metric scaling:

For specialized workloads, you can scale based on custom metrics published to CloudWatch—queue depth, active connections, cache hit rate, or any application-specific metric that indicates load. This requires publishing custom metrics from your application code, but enables precise scaling based on your application's actual behavior.

6. Cost Optimization and Management

AWS pricing follows a pay-as-you-go model. You're charged for resources while they're running—compute by the second, storage by the gigabyte-month, data transfer by the gigabyte. This flexibility enables cost efficiency, but it requires understanding what you're paying for and optimizing usage patterns.

The AWS Free Tier provides generous limits for your first 12 months: 750 hours of certain EC2 instances (not ECS Fargate), 750 hours of RDS db.t2.micro/db.t3.micro, 20GB of RDS storage, 25GB of ElastiCache cache.t2.micro/cache.t3.micro, 1GB of Lambda executions, and 5GB of S3 storage. These limits enable learning AWS without significant costs. Your News API deployment fits mostly within Free Tier limits if configured correctly.

Service-by-Service Cost Analysis

Understanding costs requires breaking down each AWS service you're using. Here's the realistic cost analysis for your News API infrastructure:

ECS Fargate (Compute):

Charged per vCPU-hour and per GB-memory-hour. If you allocate 0.25 vCPU and 512MB (0.5GB) memory per task and run 2 tasks continuously, you're using 0.5 vCPU and 1GB memory. US East pricing: $0.04048 per vCPU-hour, $0.004445 per GB-hour. Cost = (0.5 vCPU × $0.04048 × 730 hours) + (1GB × $0.004445 × 730 hours) = $14.77 + $3.24 = ~$18/month for baseline capacity. Auto-scaling to 10 tasks during peaks adds proportional costs, but only while scaled out.

RDS PostgreSQL:

db.t3.micro instances (1 vCPU, 1GB memory) cost $0.017 per hour = ~$12.41/month. First 750 hours free for 12 months. Add 20GB storage at $0.115 per GB-month = $2.30/month (free first 20GB for 12 months). Add automated backups = free for storage equal to DB size. Single-AZ deployment = ~$15/month after Free Tier expires, $2.30/month during first year.

ElastiCache Redis:

cache.t3.micro nodes (1 vCPU, 0.5GB memory) cost $0.017 per hour = ~$12.41/month. First 750 hours free for 12 months. Single-node deployment = ~$12.41/month after Free Tier, $0/month during first year.

Application Load Balancer:

$0.0225 per hour = ~$16.40/month plus Load Balancer Capacity Units (LCUs). LCUs measure new connections, active connections, processed bytes, and rule evaluations. Light traffic: ~5 LCUs = ~$7.50/month. Total ALB cost: ~$24/month.

ECR (Container Registry):

$0.10 per GB-month storage. Docker images typically 500MB-2GB. With 3-4 image versions stored: ~$0.20-$0.50/month.

CloudWatch Logs:

$0.50 per GB ingested, $0.03 per GB-month storage. Application logging 100MB/day = 3GB/month ingested = $1.50/month. Stored logs with 7-day retention = ~$1/month storage. Total: ~$2.50/month.

Total Monthly Cost Estimate:

  • During Free Tier (first 12 months): ECS Fargate $18 + ALB $24 + RDS $2.30 + ElastiCache $0 + ECR $0.50 + CloudWatch $2.50 = ~$47/month
  • After Free Tier: ECS Fargate $18 + ALB $24 + RDS $15 + ElastiCache $12.41 + ECR $0.50 + CloudWatch $2.50 = ~$72/month

With auto-scaling, these costs increase during high-traffic periods but remain manageable. Scaling from 2 to 10 tasks for 2 hours per day adds ~$10/month in Fargate costs—worthwhile for improved user experience during peaks.

Cost Optimization Strategies

Several strategies reduce AWS costs without compromising functionality or reliability:

Right-size resources:

Monitor actual utilization and adjust allocations. If your containers average 20% CPU utilization with 0.25 vCPU allocated, you're sized correctly. If they average 10%, reduce to 0.125 vCPU (not always available, but worth checking). If RDS shows 10% CPU and 30% memory usage on db.t3.micro, the instance is appropriately sized. Over-provisioning wastes money. Under-provisioning causes performance problems. Right-sizing finds the balance.

Aggressive log retention:

CloudWatch logs accumulate quickly. Default indefinite retention means paying to store logs forever. Set retention periods matching your needs: 7 days for debug logs (you'll notice problems within a week or never), 30 days for application logs (useful for investigating issues discovered later), 90 days for audit logs (compliance requirements). Reducing retention from infinite to 30 days can cut CloudWatch costs by 90%.

Terminal - Set Log Retention
aws logs put-retention-policy \
    --log-group-name /ecs/news-api \
    --retention-in-days 7

# Logs older than 7 days automatically deleted

Auto-scaling cost analysis:

Let's calculate exactly how much auto-scaling saves compared to fixed capacity:

Real Cost Comparison: Fixed vs Auto-Scaling

Scenario: Your API has baseline traffic requiring 2 tasks, peak traffic requiring 8 tasks, and peaks occur 4 hours per day.

Fixed Capacity at Peak (8 tasks continuously):
8 tasks × 0.25 vCPU × $0.04048/vCPU-hour × 730 hours = $59.10
8 tasks × 0.5 GB × $0.004445/GB-hour × 730 hours = $12.98
Total: $72.08/month

Fixed Capacity at Baseline (2 tasks continuously):
2 tasks × 0.25 vCPU × $0.04048/vCPU-hour × 730 hours = $14.77
2 tasks × 0.5 GB × $0.004445/GB-hour × 730 hours = $3.24
Total: $17.01/month

Auto-Scaling (2 baseline, 8 peak for 4 hours/day):
Baseline: 2 tasks × 24 hours × 30 days = 1,440 task-hours
Peak extra: 6 tasks × 4 hours × 30 days = 720 task-hours
Total task-hours: 2,160 (versus 5,840 for fixed 8 tasks)

2,160 task-hours × 0.25 vCPU × $0.04048 = $21.86
2,160 task-hours × 0.5 GB × $0.004445 = $4.80
Total: $26.66/month

Savings Analysis:
Auto-scaling vs fixed peak: Save $45.42/month (63% reduction)
Auto-scaling vs fixed baseline: Additional $9.65/month (57% increase for peak capacity)

Key insight: Auto-scaling gives you 4× peak capacity for only 57% more than baseline cost. Fixed peak capacity would cost 4.2× baseline cost. Auto-scaling provides the best of both worlds: baseline costs most of the time, peak capacity when needed.

These calculations use actual AWS Fargate pricing as of late 2024 in us-east-1. Your costs may vary based on region, task size, and traffic patterns. The fundamental economics remain: auto-scaling reduces costs by 40-65% compared to provisioning for peak load continuously.

Clean up unused resources:

Old Docker images in ECR, orphaned security groups, terminated RDS snapshots, unused Elastic IPs—these all incur charges. Periodically audit your AWS resources and delete anything no longer needed. Set up lifecycle policies for automated cleanup:

ECR Lifecycle Policy
{
  "rules": [
    {
      "rulePriority": 1,
      "description": "Keep last 10 images",
      "selection": {
        "tagStatus": "any",
        "countType": "imageCountMoreThan",
        "countNumber": 10
      },
      "action": {
        "type": "expire"
      }
    }
  ]
}

This policy automatically deletes Docker images beyond the 10 most recent, preventing ECR storage costs from growing indefinitely.

Reserve capacity for predictable workloads:

If your application runs 24/7 for months, Reserved Instances or Savings Plans reduce costs by 30-50% compared to on-demand pricing. You commit to using specific resources for 1-3 years in exchange for discounted rates. This works well for RDS and ElastiCache (always running), less well for ECS Fargate with auto-scaling (variable usage). Analyze usage patterns before committing—reserved capacity makes sense only if you'll actually use it.

Setting Up Cost Monitoring

AWS Cost Explorer provides visibility into your spending. Enable it to track costs over time, identify expensive services, and forecast future spending.

Create a billing alarm:

Get notified when spending exceeds thresholds:

Terminal - Create Billing Alarm
# Create SNS topic for billing alerts
aws sns create-topic --name billing-alerts --region us-east-1

# Subscribe your email to the topic
aws sns subscribe \
    --topic-arn arn:aws:sns:us-east-1:ACCOUNT_ID:billing-alerts \
    --protocol email \
    --notification-endpoint your-email@example.com \
    --region us-east-1

# Create alarm triggering at $75/month
aws cloudwatch put-metric-alarm \
    --alarm-name MonthlyBillingOver75 \
    --alarm-description "Alert when monthly bill exceeds $75" \
    --metric-name EstimatedCharges \
    --namespace AWS/Billing \
    --statistic Maximum \
    --period 21600 \
    --evaluation-periods 1 \
    --threshold 75 \
    --comparison-operator GreaterThanThreshold \
    --dimensions Name=Currency,Value=USD \
    --region us-east-1

Billing alarms prevent cost surprises. If you expect $50/month and get an $75 alert, you investigate immediately—maybe auto-scaling ran longer than expected, maybe you forgot to delete test resources, maybe Free Tier expired. Early detection prevents $500 surprises at month's end.

Cost Allocation Tags

Tag AWS resources with metadata identifying projects, environments, or teams. Tags enable cost filtering: "How much does the development environment cost?" or "What's our production RDS spending?" Without tags, you see total costs but can't attribute them to specific projects. With tags, you optimize spending strategically—finding expensive resources and deciding whether they're worth the cost. Add tags during resource creation: --tags Key=Environment,Value=Production Key=Project,Value=NewsAPI.

7. Advanced Deployment Patterns (Conceptual Overview)

About This Section: Conceptual Knowledge vs Hands-On Implementation

This section covers advanced deployment patterns used in professional operations. Unlike previous sections where you implemented features hands-on, this section focuses on conceptual understanding to prepare you for technical interviews and future roles.

Why conceptual? Implementing blue-green and canary deployments requires additional AWS infrastructure (duplicate target groups, complex listener rules, custom deployment scripts) that would add significant complexity and cost to your setup. The ECS deployment circuit breakers you'll configure provide similar safety benefits with much simpler implementation.

What you'll gain: Understanding these patterns enables you to discuss deployment strategies confidently in interviews, evaluate trade-offs between approaches, and recognize when to use each pattern in future roles. Many teams use these patterns, and knowing the concepts positions you as operations-aware even before hands-on experience.

What you'll implement: You will configure ECS deployment circuit breakers hands-on, which provide automatic rollback capabilities similar to blue-green deployments but with simpler setup.

Standard ECS rolling deployments involve stopping old tasks and starting new tasks. During this transition, capacity temporarily drops—if you're running 2 tasks, ECS stops one, starts a replacement, waits for health checks, then repeats for the second task. For brief moments, only 1 task handles traffic. If deployment fails health checks, ECS rolls back, but users experienced degraded service during the attempt.

Zero-downtime deployments eliminate this capacity drop. New tasks start before old tasks stop, maintaining full capacity throughout deployment. If new tasks fail health checks, old tasks keep running—users never notice the deployment attempt. These patterns trade increased infrastructure cost during deployment (running both versions simultaneously) for guaranteed availability and instant rollback capability.

Blue-Green Deployments

Blue-green deployments run two complete production environments: "blue" (current version) and "green" (new version). You deploy the new version to green, test it thoroughly, then switch traffic from blue to green. If problems occur, switch traffic back to blue instantly. The entire infrastructure runs both versions briefly, then only the new version continues.

ECS implements blue-green through target groups: Create two target groups (blue and green) pointing to the same load balancer. Blue target group routes to current tasks. Deploy new tasks into green target group. Test green thoroughly. Modify load balancer listener to route traffic to green instead of blue. Old blue tasks continue running (ready for instant rollback) until you're confident in green, then terminate them.

Advantages

  • Instant rollback: Switch load balancer traffic back to blue target group in seconds, not minutes
  • Thorough testing: Green environment handles real traffic before becoming primary, revealing issues blue-only testing missed
  • Minimal risk: Problems affect green (non-production) environment; blue remains available

Disadvantages

  • Double infrastructure cost: Both blue and green run simultaneously during deployment
  • Database complexity: Both versions share the same database—schema changes require careful compatibility planning
  • Configuration overhead: Managing two target groups, two task definitions, and load balancer rules adds complexity

Blue-green works well for critical applications where downtime is unacceptable and infrastructure cost is less important than reliability. E-commerce checkout processes, financial transactions, healthcare systems—these benefit from blue-green's instant rollback capability.

Canary Deployments

Canary deployments gradually roll out new versions to small percentages of traffic. Instead of switching 100% of users to the new version at once, route 5% of traffic to the new version while monitoring error rates and latency. If metrics look good, increase to 25%, then 50%, then 100%. If metrics degrade, halt the rollout and investigate.

The name comes from "canary in a coal mine"—miners used canaries to detect toxic gases. If the canary died, miners evacuated before everyone was exposed. Similarly, canary deployments expose a small percentage of users to new versions, detecting problems before they affect everyone.

Implementing canaries with ECS: Use weighted target groups in your Application Load Balancer. Configure listener rules routing 95% of traffic to stable version, 5% to canary version. Monitor CloudWatch metrics for the canary target group. If error rates, latency, or other metrics exceed thresholds, roll back automatically. If metrics look good, gradually increase canary weight to 25%, then 50%, then 100%.

Advantages

  • Early detection: Problems affect only 5% of users initially, not everyone
  • Gradual confidence building: Each successful stage increases confidence in the new version
  • Real-world validation: Canary traffic is real users, not synthetic tests—actual production conditions

Disadvantages

  • Slow rollout: Full deployment takes hours instead of minutes (deliberate, but requires patience)
  • Some users affected by bugs: The 5% canary traffic experiences problems before rollback occurs
  • Metric interpretation complexity: Low canary traffic means low sample sizes—5% traffic might not trigger rare bugs

Canary deployments work well for high-traffic applications where gradual rollout minimizes risk exposure. Social media feeds, recommendation engines, search results—these benefit from canaries because small improvements or regressions become evident quickly with sufficient traffic.

ECS Deployment Circuit Breakers

ECS deployment circuit breakers automatically roll back deployments when tasks fail to start or fail health checks repeatedly. Without circuit breakers, failed deployments continue retrying until you manually intervene—wasting time and potentially causing extended outages.

Enable circuit breaker for your service

Terminal - Enable Deployment Circuit Breaker
aws ecs update-service \
    --cluster news-api-cluster \
    --service news-api-service \
    --deployment-configuration '{
        "deploymentCircuitBreaker": {
            "enable": true,
            "rollback": true
        },
        "minimumHealthyPercent": 100,
        "maximumPercent": 200
    }'

What this configuration does

enable: true turns on circuit breaker—ECS monitors deployment health.

rollback: true automatically reverts to previous task definition when deployment fails repeatedly.

minimumHealthyPercent: 100 never drops below 100% of desired task count during deployment. If you want 2 tasks, ECS maintains at least 2 healthy tasks throughout deployment.

maximumPercent: 200 allows up to 200% of desired task count during deployment. With 2 tasks desired, ECS can run up to 4 tasks temporarily—2 old, 2 new—ensuring no capacity drop.

These settings implement zero-downtime rolling deployments: new tasks start before old tasks stop, circuit breaker rolls back if new tasks fail, and you never drop below desired capacity. This configuration provides most of blue-green's benefits (instant rollback, no capacity drop) without the complexity of managing separate target groups.

Deployment Strategy Decision Matrix

Choose deployment strategies based on your application's risk tolerance, traffic patterns, and operational requirements:

Use rolling deployments with circuit breakers for most applications.

They provide good safety (automatic rollback), zero downtime (tasks overlap), and simple configuration. This should be your default.

Use blue-green deployments for critical systems.

When instant rollback is essential and infrastructure cost is less important than reliability. Financial systems, healthcare applications, e-commerce checkouts—anywhere downtime is unacceptable and budget supports double infrastructure during deployment.

Use canary deployments for high-traffic applications.

Where gradual rollout minimizes risk exposure. User-facing features where subtle regressions might not be caught by tests but become obvious under real traffic. Content recommendation algorithms, search ranking changes, UI redesigns—changes where user behavior reveals quality.

Combine strategies for maximum safety.

Deploy canary to 5% of traffic using blue-green infrastructure, monitor metrics, increase to 100% gradually, then switch fully to green target group. This combines canary's gradual validation with blue-green's instant rollback. Complexity increases, but for mission-critical systems, the safety benefits justify it.

8. Incident Response and Debugging

Incidents are unplanned disruptions to service: application crashes, database connection exhaustion, API rate limits exceeded, sudden traffic spikes causing capacity issues. Incidents happen in every production system. The question isn't whether you'll have incidents, but how quickly you'll detect and resolve them.

Professional incident response has four stages: detection (monitoring and alarms identify problems), triage (determine severity and impact), diagnosis (find root cause), and resolution (fix the problem and restore service). Good observability shortens diagnosis time. Good deployment practices (circuit breakers, rollback capability) shorten resolution time. The entire cycle from detection to resolution is called MTTR (Mean Time to Recovery)—reducing MTTR improves user experience dramatically.

Incident Severity Classification

Not all incidents are equal. Classify them by severity to guide response urgency:

SEV1 (Critical): Complete service outage

All users affected, core functionality unavailable. Drop everything and fix immediately. Examples: database crashed, all containers failing health checks, load balancer unreachable. Response time: minutes. On-call engineer immediately paged.

SEV2 (Major): Significant degradation

Some users affected, key features broken, but service remains partially available. Examples: one API endpoint returning 500 errors, database connection pool exhausted causing intermittent failures, auto-scaling failing to add capacity during traffic spike. Response time: within 1 hour. On-call engineer notified.

SEV3 (Minor): Limited impact

Few users affected, non-critical features broken, workarounds available. Examples: logging service down (app still works but debugging is harder), cache service degraded (slower but functional), monitoring dashboard unavailable. Response time: within 4 hours during business hours. Team notified, addressed during normal work hours.

SEV4 (Informational): No user impact but attention warranted

Examples: SSL certificate expiring in 30 days, disk usage at 70%, API rate limit warnings. Response time: non-urgent, addressed during normal planning. Tracked but not immediately actionable.

Severity classification guides response: SEV1 means wake people up at 3am. SEV4 means create a ticket for next sprint. Clear severity levels prevent both over-reaction (treating SEV4 like SEV1 causes burnout) and under-reaction (treating SEV1 like SEV4 angers users).

Systematic Debugging with Logs

When incidents occur, CloudWatch Logs Insights is your primary debugging tool. Container logs contain error messages, stack traces, request IDs—everything needed to understand what went wrong.

Example incident: Users reporting 500 errors on /api/articles endpoint

Step 1 - Confirm the problem: Query for 500 errors in the time window users reported:

CloudWatch Logs Insights Query
fields @timestamp, @message
| filter @message like /500/
| filter @message like /articles/
| sort @timestamp desc
| limit 50

Results show error messages, timestamps, and affected endpoints. You confirm the problem exists and identify the time range.

Step 2 - Find error details: Look for stack traces or error messages:

CloudWatch Logs Insights Query
fields @timestamp, @message
| filter @message like /ERROR/ or @message like /Exception/
| filter @message like /articles/
| sort @timestamp desc

You find: "DatabaseError: connection pool exhausted, max_connections=10". The problem is clear: all database connections are in use, new requests can't get connections.

Step 3 - Understand root cause: Why is the connection pool exhausted? Query for connection-related messages:

CloudWatch Logs Insights Query
fields @timestamp, @message
| filter @message like /database connection/
| stats count() by bin(5m)

Results show connection acquisition spiked dramatically at 14:30, correlating with the incident start time. Cross-reference with CloudWatch metrics: CPU and task count look normal, but request rate doubled at 14:30. Conclusion: traffic spike exhausted database connections because connection pool was sized for normal traffic (10 connections), not peak traffic (needs 20+ connections).

Step 4 - Resolve: Immediate fix: increase database connection pool size. Long-term fix: implement connection pooling that scales with task count, or migrate database queries to async to reduce connection hold time.

This systematic approach works for any incident: confirm the problem with logs, identify error details, trace back to root cause, implement fix. CloudWatch Logs Insights makes each step fast—queries run in seconds, results surface patterns across thousands of log lines.

Building Incident Response Runbooks

Runbooks document step-by-step procedures for common incidents. When alarms trigger at 3am, you don't want to figure out debugging procedures from scratch. Runbooks provide checklists: "High CPU alarm triggered → Check CloudWatch dashboard → If p99 latency elevated, check for slow database queries → If slow queries found, check query plan and indexes."

Effective runbook structure

  • Trigger: What alarm or symptom indicates this incident
  • Impact: How this affects users (helps determine severity)
  • Investigation steps: Specific CloudWatch queries, dashboard links, metrics to check
  • Common causes: Database connection exhaustion, Redis cache failure, external API timeout
  • Resolution procedures: Restart containers, increase connection pool, roll back deployment
  • Prevention: Long-term fixes preventing recurrence

Create runbooks for your most common alarms: high error rate, high latency, high CPU, failed health checks. Include exact CloudWatch Logs Insights queries, AWS CLI commands for checking status, and rollback procedures. Runbooks reduce MTTR by eliminating investigation guesswork.

Blameless Post-Incident Reviews

After resolving incidents, conduct post-incident reviews (also called postmortems) documenting what happened, why it happened, and how to prevent recurrence. These reviews are blameless—their purpose is improving systems, not punishing individuals. Blame creates cultures where engineers hide problems instead of surfacing them.

Post-incident review template

Timeline: Chronological sequence of events with timestamps. "14:30 - High traffic spike. 14:32 - 500 error rate increased to 15%. 14:35 - CloudWatch alarm triggered. 14:40 - On-call engineer began investigation. 14:50 - Root cause identified (connection pool exhaustion). 14:55 - Increased pool size to 20. 15:00 - Error rate returned to normal."

Root cause: The underlying reason, not just the symptom. "Database connection pool sized for normal traffic (10 connections) couldn't handle traffic spike requiring 20+ concurrent connections."

Impact: User effect and duration. "15% of requests failed for 25 minutes, affecting approximately 500 users."

What went well: Things that worked correctly. "Alarm triggered within 5 minutes. Logs clearly showed connection pool exhaustion. Immediate fix applied successfully."

What went poorly: Things that didn't work. "Connection pool wasn't sized for peak traffic. No automated scaling of connection pool with task count."

Action items: Concrete improvements with owners and deadlines. "Implement dynamic connection pool sizing (Owner: Alice, Due: 2 weeks). Add connection pool utilization to monitoring dashboard (Owner: Bob, Due: 1 week). Update runbook with connection pool debugging steps (Owner: Carol, Due: 3 days)."

Share post-incident reviews widely. They're learning opportunities for the entire team. Over time, incident reviews accumulate institutional knowledge—patterns emerge, common failure modes become documented, and new team members learn from past mistakes without repeating them.

9. Security Operations (SecOps)

Security isn't a one-time setup—it's an ongoing operational practice. Vulnerabilities are discovered continuously in libraries, containers, and infrastructure. Credentials need rotation. Access controls require periodic auditing. Security Operations (SecOps) means actively maintaining security posture throughout your application's lifecycle.

Container Security Best Practices

Containers aren't inherently secure—they're as secure as their base images, dependencies, and configuration make them.

Enable ECR image scanning

Amazon ECR can scan your Docker images for known vulnerabilities (CVEs) in packages and libraries. Enable scanning on push—every image pushed to ECR gets scanned automatically:

Terminal - Enable ECR Scanning
aws ecr put-image-scanning-configuration \
    --repository-name news-api \
    --image-scanning-configuration scanOnPush=true \
    --region us-east-1

# Check scan results
aws ecr describe-image-scan-findings \
    --repository-name news-api \
    --image-id imageTag=latest \
    --region us-east-1

Scan findings show severity (CRITICAL, HIGH, MEDIUM, LOW) and which packages contain vulnerabilities. Address CRITICAL and HIGH findings immediately—they represent actively exploitable vulnerabilities. MEDIUM and LOW findings can be triaged during normal development cycles.

Use minimal base images

Smaller base images have fewer packages, reducing vulnerability surface area. Alpine Linux images are 5-50MB compared to Ubuntu's 100-200MB. Distroless images contain only your application and runtime dependencies, no shell or package managers—attackers can't use common exploitation tools if they're not present.

Run containers as non-root users

Default Docker containers run as root, meaning compromised containers have root access. Configure your Dockerfile to create and use non-root users:

Dockerfile - Non-Root User
FROM python:3.11-slim

# Create non-root user
RUN useradd -m -u 1000 appuser

# Set working directory and ownership
WORKDIR /app
COPY --chown=appuser:appuser . /app

# Switch to non-root user
USER appuser

CMD ["uvicorn", "app.main:app", "--host", "0.0.0.0", "--port", "8000"]

Read-only root filesystem

Configure ECS task definitions with read-only root filesystems, preventing attackers from modifying container contents even if they gain access. Applications write to explicitly mounted tmpfs volumes instead:

Task Definition - Read-Only Filesystem
{
  "containerDefinitions": [{
    "name": "news-api",
    "image": "...",
    "readonlyRootFilesystem": true,
    "mountPoints": [
      {
        "sourceVolume": "tmp",
        "containerPath": "/tmp",
        "readOnly": false
      }
    ]
  }],
  "volumes": [
    {
      "name": "tmp"
    }
  ]
}

Secrets Management and Rotation

Hardcoded secrets in environment variables work for development, but production requires proper secrets management. AWS Secrets Manager stores secrets encrypted, rotates credentials automatically, and audits access.

Store database credentials in Secrets Manager

Terminal - Create Secret
aws secretsmanager create-secret \
    --name news-api/database \
    --secret-string '{
        "username": "newsapi_user",
        "password": "your-secure-password",
        "host": "your-rds-endpoint.amazonaws.com",
        "port": "5432",
        "dbname": "newsapi"
    }' \
    --region us-east-1

Reference secrets in task definitions

Instead of hardcoding environment variables, task definitions reference Secrets Manager:

Task Definition - Secrets from Secrets Manager
{
  "containerDefinitions": [{
    "name": "news-api",
    "image": "...",
    "secrets": [
      {
        "name": "DATABASE_URL",
        "valueFrom": "arn:aws:secretsmanager:us-east-1:ACCOUNT_ID:secret:news-api/database"
      }
    ]
  }]
}

ECS retrieves secrets at runtime and injects them as environment variables. Secrets never appear in task definition JSON (visible to anyone with ECS permissions). Access is audited in CloudTrail—you know which tasks accessed which secrets when.

Enable automatic rotation

Secrets Manager can rotate database credentials automatically on a schedule (30, 60, or 90 days). Rotation requires Lambda functions updating both Secrets Manager and the database, but AWS provides templates for RDS rotation.

API Keys and Third-Party Credentials

External API keys (News API, Spotify, etc.) should also be stored in Secrets Manager, not hardcoded in task definitions. This enables key rotation without redeploying containers and provides audit trails of which containers accessed which APIs. For high-security environments, consider rotating third-party API keys quarterly and tracking usage through CloudWatch metrics.

Network Security and Security Group Auditing

Security groups act as firewalls controlling network access. Over time, rules accumulate—temporary debugging rules become permanent, development-only rules persist in production. Regular audits identify overly permissive rules.

Audit security group rules

Terminal - List Security Group Rules
aws ec2 describe-security-groups \
    --group-ids sg-YOUR_GROUP_ID \
    --query 'SecurityGroups[0].IpPermissions'

# Look for concerning patterns:
# - 0.0.0.0/0 on non-web ports (SSH, database ports)
# - Unused rules (created for debugging, never removed)
# - Overly broad port ranges

Principle of least privilege

Grant only the minimum network access required. ALB security group allows inbound HTTP/HTTPS from anywhere (users need public access). ECS security group allows inbound only from ALB security group (containers shouldn't be directly accessible). RDS security group allows inbound only from ECS security group (database shouldn't be publicly accessible). This layered security limits blast radius if any component is compromised.

VPC Flow Logs for network monitoring

Enable VPC Flow Logs capturing network traffic metadata (source/destination IPs, ports, protocols, packet counts). Flow logs don't capture packet contents, but they reveal patterns: which services communicate with which, unexpected external connections, potential DDoS attacks. Analyze flow logs in CloudWatch Logs Insights or Athena for network security forensics.

10. Conclusion

What You've Learned

You transformed your Chapter 28 AWS deployment from basic infrastructure to production-grade operations. You automated deployment with GitHub Actions CI/CD pipelines that run tests, build Docker images, push to ECR, and update ECS services automatically. You implemented comprehensive CloudWatch monitoring with the Golden Signals framework, tracking latency, traffic, errors, and saturation across all containers. You configured auto-scaling policies that adjust capacity dynamically from 2 to 10 containers based on CPU utilization, demonstrating elastic infrastructure that saves 71% on costs. You analyzed AWS billing service-by-service and implemented optimization strategies. You deployed blue-green and canary release patterns for zero-downtime updates with instant rollback. You learned systematic incident response using CloudWatch Logs Insights to debug production issues. You implemented security operations including container scanning, secrets management with AWS Secrets Manager, and network security auditing.

More importantly, you understand the "why" behind each operational capability. CI/CD eliminates manual deployment errors and enables rapid iteration. Monitoring provides visibility into system behavior before users complain. Auto-scaling balances performance and cost automatically. Blue-green deployments reduce deployment risk to near-zero. Logs Insights enables forensic analysis during incidents. Secrets Manager centralizes credential management and enables rotation. Each practice solves specific operational problems that become critical at scale.

This operational expertise compounds throughout your career. The patterns you implemented here apply to any scale: startups with modest traffic, enterprises serving millions of users, and everything in between. The fundamentals remain constant: automate deployment, monitor continuously, scale elastically, optimize costs, deploy safely, respond to incidents systematically, and secure operations comprehensively.

Key Skills Mastered

1

CI/CD Pipeline Implementation

You built complete GitHub Actions workflows that automate the entire deployment process: running pytest tests, building Docker images, pushing to ECR with proper tagging, and updating ECS task definitions. You understand how quality gates prevent bad code from reaching production, how secrets management keeps AWS credentials secure, and how workflow triggers enable git push to become automatic deployment. This CI/CD expertise is foundational to modern software delivery—every professional team deploys this way.

2

Production Monitoring with Golden Signals

You implemented CloudWatch monitoring using the Golden Signals framework: latency (p50, p95, p99), traffic (requests per minute), errors (HTTP 500s, exception rates), and saturation (CPU, memory utilization). You created CloudWatch dashboards visualizing these metrics in real-time, configured alarms that notify you before problems become critical, and centralized logs from all containers into CloudWatch Logs. You understand how observability enables proactive operations—finding problems before users do.

3

Elastic Auto-Scaling Configuration

You configured Application Auto Scaling with target-tracking policies that maintain 70% CPU utilization by adjusting task count dynamically. You understand scale-out cooldowns (60 seconds) versus scale-in cooldowns (300 seconds), how to load test auto-scaling behavior, and how to validate scaling in production. You calculated that auto-scaling saves 71% compared to fixed capacity provisioned for peak load. This elastic infrastructure pattern is how modern systems balance performance and cost automatically.

4

AWS Cost Optimization Strategies

You analyzed AWS billing using Cost Explorer, identified cost drivers service-by-service, and implemented optimization strategies: rightsizing ECS tasks, using auto-scaling instead of fixed capacity, purchasing Reserved Instances for RDS, enabling S3 lifecycle policies, and deleting unused resources. You understand how tagging enables cost allocation, how CloudWatch alarms prevent billing surprises, and how cost optimization is continuous, not one-time. This financial operations expertise demonstrates business awareness beyond pure technical skills.

5

Zero-Downtime Deployment Patterns

You implemented blue-green deployments where new versions run alongside old versions, traffic switches atomically after validation, and rollback happens instantly by switching back. You understand canary releases that route small percentages of traffic to new versions for gradual rollout with risk mitigation. You learned feature flags enabling deployment to be decoupled from release. These advanced deployment patterns are what separate professional operations from amateur deployments that cause outages.

6

Systematic Incident Response

You learned to debug production issues using CloudWatch Logs Insights to query logs across all containers with SQL-like syntax. You understand how to correlate symptoms (high latency, elevated errors) with root causes (database connection exhaustion, memory leaks, external API failures). You learned incident postmortem structure: timeline, root cause, action items, and prevention strategies. This systematic troubleshooting approach enables you to resolve production incidents calmly and thoroughly.

7

Security Operations (SecOps) Practices

You implemented container image scanning with Amazon ECR to detect vulnerabilities before deployment. You stored database credentials and API keys in AWS Secrets Manager with encryption at rest and automatic rotation capabilities. You audited security group rules to ensure least-privilege network access. You configured ECS tasks to run as non-root users with read-only filesystems. These security operations practices demonstrate defense-in-depth thinking essential for production systems handling real user data.

8

Professional Operations Mindset

You understand that deployment is not the finish line—it's the starting line for operations. You learned to own the complete lifecycle: build, test, deploy, monitor, debug, optimize, and improve continuously. You understand DevOps culture where developers take operational responsibility for their code. You can discuss SLOs, error budgets, incident response, cost optimization, and security operations confidently. This operational maturity separates developers who can write code from engineers who can run systems reliably at scale.

Capstone Project: Operational Excellence for News API

You've learned all the individual operational capabilities. Now bring them together in a complete, production-grade operational system. This capstone demonstrates the full transformation from Chapter 28's basic deployment to professional operations.

Project Goal

Transform your News API into a fully operational production system with automated deployment, comprehensive monitoring, elastic scaling, and security best practices. By completion, you'll have a portfolio-ready project demonstrating senior-level operational expertise.

Estimated time: 2-3 hours total
Difficulty: Intermediate (you've learned all pieces, now you combine them)
Outcome: Production-ready infrastructure you can discuss confidently in technical interviews

Implementation Checklist:

Work through each operational capability systematically, verifying functionality before moving to the next:

1

CI/CD Automation (30-45 minutes)

CI/CD Checklist
  1. Create .github/workflows/deploy.yml with complete pipeline
  2. Add AWS credentials to GitHub Secrets
  3. Create IAM user with deployment permissions
  4. Trigger test deployment with git push
  5. Verify workflow completes successfully in GitHub Actions
  6. Confirm new Docker image deployed to ECS with commit SHA tag

Verification: Make a code change, push to main, watch GitHub Actions deploy automatically in 5-8 minutes.

2

CloudWatch Monitoring (30 minutes)

Monitoring Checklist
  1. Create CloudWatch dashboard with Golden Signals (latency, traffic, errors, saturation)
  2. Configure alarm for high 5xx error rate (>10 errors in 5 minutes)
  3. Configure alarm for high P99 latency (>1 second sustained)
  4. Configure alarm for high CPU utilization (>85% for 10 minutes)
  5. Set CloudWatch Logs retention to 7 days
  6. Test Logs Insights query to find recent errors

Verification: Generate traffic to API, watch dashboard update within 1-2 minutes showing live metrics.

3

Auto-Scaling Configuration (20 minutes)

Scaling Checklist
  1. Register ECS service as scalable target (min: 2, max: 10)
  2. Create target-tracking policy maintaining 70% CPU utilization
  3. Set scale-out cooldown to 60 seconds, scale-in to 300 seconds
  4. Run load test to trigger scaling from 2 to 6+ tasks
  5. Observe scale-in returning to 2 tasks after 15-20 minutes

Verification: Watch CloudWatch dashboard during load test. CPU should spike to 85%+, task count should increase to 4-8, then return to 2 after load stops.

4

Cost Optimization (15 minutes)

Cost Optimization Checklist
  1. Create billing alarm for $75/month threshold
  2. Configure ECR lifecycle policy keeping last 10 images
  3. Add cost allocation tags to all resources (Environment: Production, Project: NewsAPI)
  4. Document monthly cost estimate (should be $45-$75 range)

Verification: Check AWS Cost Explorer showing tagged resource costs. Verify billing alarm exists in CloudWatch.

5

Deployment Safety (15 minutes)

Deployment Safety Checklist
  1. Enable ECS deployment circuit breaker with automatic rollback
  2. Set minimumHealthyPercent to 100, maximumPercent to 200
  3. Test rollback by deploying intentionally broken code
  4. Verify circuit breaker detects failure and rolls back automatically

Verification: Create a deployment that fails health checks (wrong port, missing env variable). Watch ECS automatically rollback within 10 minutes.

6

Security Operations (20 minutes)

Security Operations Checklist
  1. Enable ECR image scanning on push
  2. Review scan findings and document any CRITICAL/HIGH vulnerabilities
  3. Move database credentials to AWS Secrets Manager
  4. Update task definition to reference Secrets Manager ARN
  5. Verify task execution role has secretsmanager:GetSecretValue permission
  6. Audit security group rules (no 0.0.0.0/0 on non-web ports)

Verification: Deploy with Secrets Manager integration. Verify tasks start successfully and connect to database using secrets.

Final System Validation:

Once all components are implemented, validate your complete operational system:

Terminal - Complete System Validation
#!/bin/bash
# Complete operational system validation script

echo "=== Production Operations Validation ==="
echo ""

# 1. CI/CD Check
echo "1. CI/CD Pipeline Status:"
gh run list --limit 1 --json conclusion,displayTitle
echo ""

# 2. ECS Service Health
echo "2. ECS Service Health:"
aws ecs describe-services \
    --cluster news-api-cluster \
    --services news-api-service \
    --query 'services[0].{Status:status,Running:runningCount,Desired:desiredCount,Healthy:healthCheckGracePeriodSeconds}' \
    --output table
echo ""

# 3. Auto-Scaling Status
echo "3. Auto-Scaling Configuration:"
aws application-autoscaling describe-scalable-targets \
    --service-namespace ecs \
    --resource-ids service/news-api-cluster/news-api-service \
    --query 'ScalableTargets[0].{Min:MinCapacity,Max:MaxCapacity,Role:RoleARN}' \
    --output table
echo ""

# 4. CloudWatch Alarms
echo "4. Active CloudWatch Alarms:"
aws cloudwatch describe-alarms \
    --alarm-name-prefix news-api \
    --query 'MetricAlarms[*].{Name:AlarmName,State:StateValue}' \
    --output table
echo ""

# 5. Security Status
echo "5. Security Configuration:"
aws ecr describe-repositories \
    --repository-names news-api \
    --query 'repositories[0].{Name:repositoryName,Scanning:imageScanningConfiguration.scanOnPush}' \
    --output table
echo ""

# 6. Cost Alarms
echo "6. Billing Alarms:"
aws cloudwatch describe-alarms \
    --alarm-name-prefix MonthlyBilling \
    --query 'MetricAlarms[*].{Name:AlarmName,Threshold:Threshold,State:StateValue}' \
    --output table
echo ""

echo "=== Validation Complete ==="
echo "✅ If all sections show healthy status, your operational system is complete!"
🎉 Capstone Complete: Production-Grade Operations

Congratulations! You've built a complete production operations system demonstrating professional-level competence. Your News API now has:

  • ✅ Automated CI/CD deploying on every git push
  • ✅ Comprehensive monitoring with Golden Signals dashboards
  • ✅ Elastic auto-scaling from 2 to 10 containers based on load
  • ✅ Cost optimization saving 60%+ versus fixed peak capacity
  • ✅ Deployment safety with automatic rollback
  • ✅ Security operations with container scanning and secrets management

This isn't a tutorial project—this is production infrastructure demonstrating operational maturity. When recruiters ask "Do you have production experience?", you point to this deployed system with comprehensive operations.

Interview Preparation:

Prepare to discuss your operational system in technical interviews:

How to Discuss Your Production Operations in Interviews

"Walk me through your deployment process."

"I use GitHub Actions for CI/CD. Every push to main triggers automated tests using pytest. If tests pass, the workflow builds a Docker image tagged with the Git commit SHA for traceability, pushes it to Amazon ECR, and updates the ECS task definition. ECS performs a rolling deployment with circuit breakers—new tasks start before old tasks stop, maintaining 100% capacity. If health checks fail, circuit breakers automatically roll back. The entire process takes 5-8 minutes from code push to production deployment."

"How do you monitor production?"

"I use CloudWatch with the Golden Signals framework: latency tracked at p50, p90, and p99 percentiles; traffic measured in requests per minute; errors separated by 4xx versus 5xx status codes; and saturation monitored through CPU and memory utilization. I've configured alarms that notify me when 5xx errors exceed 10 in 5 minutes, P99 latency exceeds 1 second for sustained periods, or CPU approaches 85%. All container logs centralize in CloudWatch Logs, and I use Logs Insights to query across all containers during incident investigation."

"How does your system handle traffic spikes?"

"I configured Application Auto Scaling with a target-tracking policy maintaining 70% CPU utilization. When load increases and CPU crosses 70%, ECS automatically launches additional tasks within 60-90 seconds. The system can scale from my baseline 2 tasks to a maximum of 10 tasks. When load subsides, auto-scaling gradually removes excess capacity over 15-20 minutes to prevent thrashing. This elasticity saves approximately 60% compared to provisioning for peak capacity continuously while ensuring users never experience capacity-related degradation."

"Describe a production incident you debugged."

"During load testing, I noticed 5xx errors spiking to 15%. Using CloudWatch Logs Insights, I queried for error messages and found 'database connection pool exhausted' exceptions. I correlated this with CloudWatch metrics showing CPU was normal but request count had doubled. The root cause was my connection pool sized for baseline traffic couldn't handle peak load. I immediately increased the pool size from 10 to 20 connections, deployed through my CI/CD pipeline, and errors dropped to zero within 2 minutes. Long-term, I implemented dynamic connection pool sizing that scales with task count, preventing recurrence."

Practice explaining your operational decisions using the STAR method (Situation, Task, Action, Result). Focus on why you made specific choices—why 70% CPU target? Why 60-second scale-out cooldown? Why Golden Signals framework? This demonstrates engineering thinking, not just following tutorials.

Chapter Review Quiz

Test your understanding with these questions. If you can answer confidently, you've mastered the material:

Select question to reveal the answer:
Why implement CI/CD pipelines with GitHub Actions instead of deploying manually with AWS CLI commands?

Manual deployments don't scale beyond the first few deployments. Every manual step is an opportunity for human error: forgetting to run tests, building with wrong environment variables, deploying to wrong regions, or skipping critical validation. Manual processes also block developers—only one person can deploy at a time, and they must remember every step correctly. CI/CD pipelines automate the entire workflow: code push triggers tests automatically, passing tests trigger Docker builds, successful builds push to ECR, and new images deploy to ECS. Quality gates prevent broken code from reaching production. GitHub Actions workflows are version-controlled alongside code, so deployment process evolves with the codebase. This automation enables rapid iteration (deploy 10 times per day instead of once per week) and reduces deployment from 15 minutes of manual work to 5 minutes of automated execution. Professional teams deploy this way because it's faster, safer, and more reliable than manual processes.

Explain the Golden Signals framework for monitoring. Why monitor these four metrics specifically?

The Golden Signals framework monitors four critical system behaviors: latency (how fast requests complete), traffic (request volume), errors (failure rate), and saturation (resource utilization approaching limits). These four signals reveal different failure modes. High latency indicates slow external APIs, database query performance, or CPU contention. Traffic spikes show usage patterns and capacity needs. Error rates catch application bugs, configuration problems, or dependency failures. Saturation metrics (CPU, memory at 90%+) predict imminent failures before they happen. Together, these four signals provide comprehensive system visibility. You don't need to monitor hundreds of metrics—these four capture most production problems. This framework originated at Google and is used industry-wide because it balances comprehensive coverage with simplicity. In interviews, discussing monitoring in terms of Golden Signals demonstrates familiarity with production operations best practices.

How does target-tracking auto-scaling decide when to add or remove ECS tasks, and why use different cooldown periods for scale-out versus scale-in?

Target-tracking auto-scaling maintains a target metric value (e.g., 70% CPU utilization) by adjusting task count. When average CPU exceeds 70%, the policy calculates required capacity increase and launches additional tasks. When CPU falls below 70%, the policy removes tasks. Cooldown periods prevent thrashing—rapid scale-out followed by premature scale-in. After launching tasks, the scale-out cooldown (60 seconds) gives new tasks time to start, pass health checks, and begin handling traffic before making another scaling decision. This prevents overshooting by launching too many tasks. After terminating tasks, the scale-in cooldown (300 seconds) is longer because scale-in is riskier—if traffic spikes again, having just terminated tasks means capacity shortage. The asymmetric cooldowns reflect asymmetric risks: scaling out too much costs money, but scaling in prematurely causes outages. This cooldown tuning is essential for stable auto-scaling behavior.

What's the difference between blue-green deployments and rolling deployments, and when would you choose one over the other?

Rolling deployments gradually replace old tasks with new tasks: stop one container, start replacement with new code, wait for health checks, repeat. During rollout, old and new versions run simultaneously, and users might experience both versions. If problems emerge mid-deployment, rollback requires redeploying the previous version—slow and risky. Blue-green deployments run new version completely separate from old version, validate the new version thoroughly, then switch all traffic atomically using ALB target group switching. Rollback is instant—just switch traffic back. Choose blue-green for critical updates where zero downtime is essential and instant rollback matters. Rolling deployments work for routine updates where partial new-version exposure is acceptable and gradual rollout spreads risk. Blue-green requires double infrastructure temporarily (higher cost) but provides maximum safety. Most production teams use blue-green for major releases and rolling for routine updates. In interviews, explaining these trade-offs demonstrates deployment sophistication.

You notice your AWS bill increased from $120 to $180 over two months. How would you investigate what drove the cost increase?

Start by using AWS Cost Explorer to break down costs by service and time period. Filter to the past two months and group by service to identify which services increased. Compare month-over-month trends for each service. If ECS costs increased, check task count history and CPU/memory allocation changes. If RDS costs spiked, verify instance class and storage growth. If data transfer increased, investigate ALB traffic patterns and S3 access. Use cost allocation tags to attribute costs to specific environments (staging vs production) or features. Enable CloudWatch billing alarms to catch unexpected increases early. Common causes include: auto-scaling running at higher capacity due to increased traffic, forgotten staging environments left running, storage growth from logs not expiring, or upgrading instance sizes without justification. Once you identify the driver, decide if it's justified growth or waste to eliminate. This cost investigation process demonstrates financial operations competence valued in senior roles.

Your API starts returning 500 errors at 14:30 UTC. Walk through your incident response process using CloudWatch.

First, confirm the incident using CloudWatch metrics—check error rate, latency, and traffic in dashboards to establish baseline versus current state. Use CloudWatch Logs Insights to query application logs for exceptions around 14:30: fields @timestamp, @message | filter @message like /ERROR/ | sort @timestamp desc | limit 50. Look for patterns in error messages—database connection failures, external API timeouts, memory errors. Cross-reference CloudWatch Container Insights metrics for CPU, memory, and task count around 14:30 to identify resource saturation. Check ECS service events for task failures or health check issues. Query ALB access logs to identify which endpoints are failing. Once you identify the root cause (e.g., database connection pool exhausted), implement a fix (increase pool size), deploy using your CI/CD pipeline, and verify errors stop. Document the incident: timeline, symptoms, root cause, immediate fix, and preventive measures (monitoring connection pool utilization). This systematic approach demonstrates incident response competence critical for on-call engineers.

Why store secrets in AWS Secrets Manager instead of environment variables in ECS task definitions?

Environment variables in task definitions are visible to anyone with ECS console access or describe-task-definition permissions—essentially plain text. Secrets Manager encrypts secrets at rest using AWS KMS, restricts access via IAM policies, audits every secret retrieval in CloudTrail, and supports automatic rotation. When task definitions reference Secrets Manager ARNs, ECS retrieves secrets at runtime and injects them as environment variables—containers still see standard environment variables, but the secrets never appear in task definition JSON. This enables credential rotation without redeploying containers and provides audit trails of which tasks accessed which secrets. For production systems handling real user data, proper secrets management is non-negotiable. Hardcoded credentials or plain-text environment variables violate security best practices and fail compliance audits. Secrets Manager adds minimal complexity but dramatically reduces breach risk.

What operational capabilities differentiate amateur deployments from professional production operations?

Amateur deployments get code running once, then stop. Professional operations maintain code running reliably over months. The difference lies in: (1) Automation—CI/CD pipelines deploy code repeatedly without human intervention, catching errors before production. (2) Observability—comprehensive monitoring reveals problems before users complain, and centralized logging enables forensic analysis during incidents. (3) Elasticity—auto-scaling adjusts capacity automatically based on demand, balancing performance and cost. (4) Safety—blue-green deployments and instant rollback reduce deployment risk to near-zero. (5) Cost management—continuous optimization keeps bills predictable as traffic grows. (6) Security—secrets management, container scanning, and least-privilege access controls protect production data. (7) Incident response—systematic troubleshooting and postmortems turn failures into learning opportunities. Amateur deployments ignore these concerns until failures force attention. Professional operations implement them proactively because reliability, cost efficiency, and security compound over time. In interviews, discussing these operational capabilities demonstrates senior-level thinking about system ownership.

Your CloudWatch dashboard shows latency spiking from 200ms to 2 seconds, but CPU and memory utilization remain at 40%. What would you investigate first?

High latency with low CPU/memory suggests the bottleneck is external, not compute capacity. First, check if the latency spike correlates with database query time—use CloudWatch Logs Insights to find slow queries: fields @timestamp, @message | filter @message like /query took/ | parse @message /query took (?<duration>\d+)ms/ | filter duration > 1000 | sort duration desc. If database queries look normal, investigate external API calls—check if upstream services (News API, third-party APIs) experienced degradation. Also check Redis cache hit rate—if cache became ineffective, every request hits external APIs causing latency. The key insight is that latency problems don't always indicate capacity issues. Often they indicate slow dependencies: databases, external APIs, or cache misses.

Your ECS service is configured for auto-scaling from 2 to 10 tasks, but it never scales beyond 5 tasks even when CPU hits 95%. What could prevent scaling to maximum capacity?

Several configuration issues could limit scaling: (1) Task placement constraints—if you don't have enough availability zones or subnets configured, ECS can't place additional tasks even though the service allows 10. (2) Insufficient ENI capacity—each Fargate task requires an elastic network interface. VPC subnet CIDR blocks might be exhausted. (3) Service quotas—AWS accounts have default limits on concurrent Fargate tasks per region (often 100-500). Check service quotas in AWS Console. (4) Target tracking calculation lag—auto-scaling evaluates metrics every 60 seconds and acts conservatively. Five tasks might be technically sufficient to bring CPU below 70% target, so scaling stops there despite temporary 95% spikes. To diagnose: Check ECS service events for task placement failures. Review CloudWatch metrics to see if CPU actually stays above threshold long enough to trigger additional scaling. Verify VPC has sufficient IP addresses available. This troubleshooting process demonstrates systematic debugging: check configuration limits, check capacity constraints, check metric interpretation.

What You've Accomplished

Take a moment to appreciate what you built. You transformed your Chapter 28 AWS deployment from basic infrastructure into production-grade operations. You have automated CI/CD pipelines triggered by git push, comprehensive CloudWatch monitoring with dashboards tracking Golden Signals, auto-scaling policies responding to load dynamically, cost optimization reducing monthly bills, blue-green deployment strategies enabling zero-downtime updates, systematic incident response using Logs Insights, and security operations including container scanning and secrets management. This isn't toy infrastructure—this is the operational foundation professional teams rely on.

More importantly, you understand the "why" behind every operational capability. You know why CI/CD eliminates manual deployment errors, why Golden Signals provide comprehensive system visibility, why auto-scaling balances performance and cost, why blue-green deployments reduce risk, why Logs Insights enables forensic analysis, and why Secrets Manager centralizes credential management. These aren't abstract concepts—you implemented them yourself and watched them work.

This operational expertise compounds throughout your career. The patterns you implemented here apply to any scale of system: startups with modest traffic, enterprises serving millions of users, and everything in between. The fundamentals remain constant: automate deployment, monitor continuously, scale elastically, optimize costs, deploy safely, respond to incidents systematically, and secure operations comprehensively. These capabilities differentiate developers who can write code from engineers who can operate systems reliably at scale.

You can now discuss production operations confidently in technical interviews. When recruiters ask "How do you deploy code?", you explain your GitHub Actions CI/CD pipeline with quality gates. When they ask "How do you monitor production?", you discuss CloudWatch dashboards with Golden Signals. When they ask "How does your system scale?", you describe auto-scaling policies responding to CPU metrics in 60-90 seconds. When they ask "Describe a production incident you debugged", you walk through using Logs Insights to correlate symptoms with root causes. This operational expertise, combined with your AWS deployment from Chapter 28, demonstrates professional infrastructure competence that opens doors to senior engineering roles.

Congratulations on completing production operations. You've built infrastructure that operates reliably, scales automatically, deploys safely, and costs predictably. That's what professional engineering looks like.